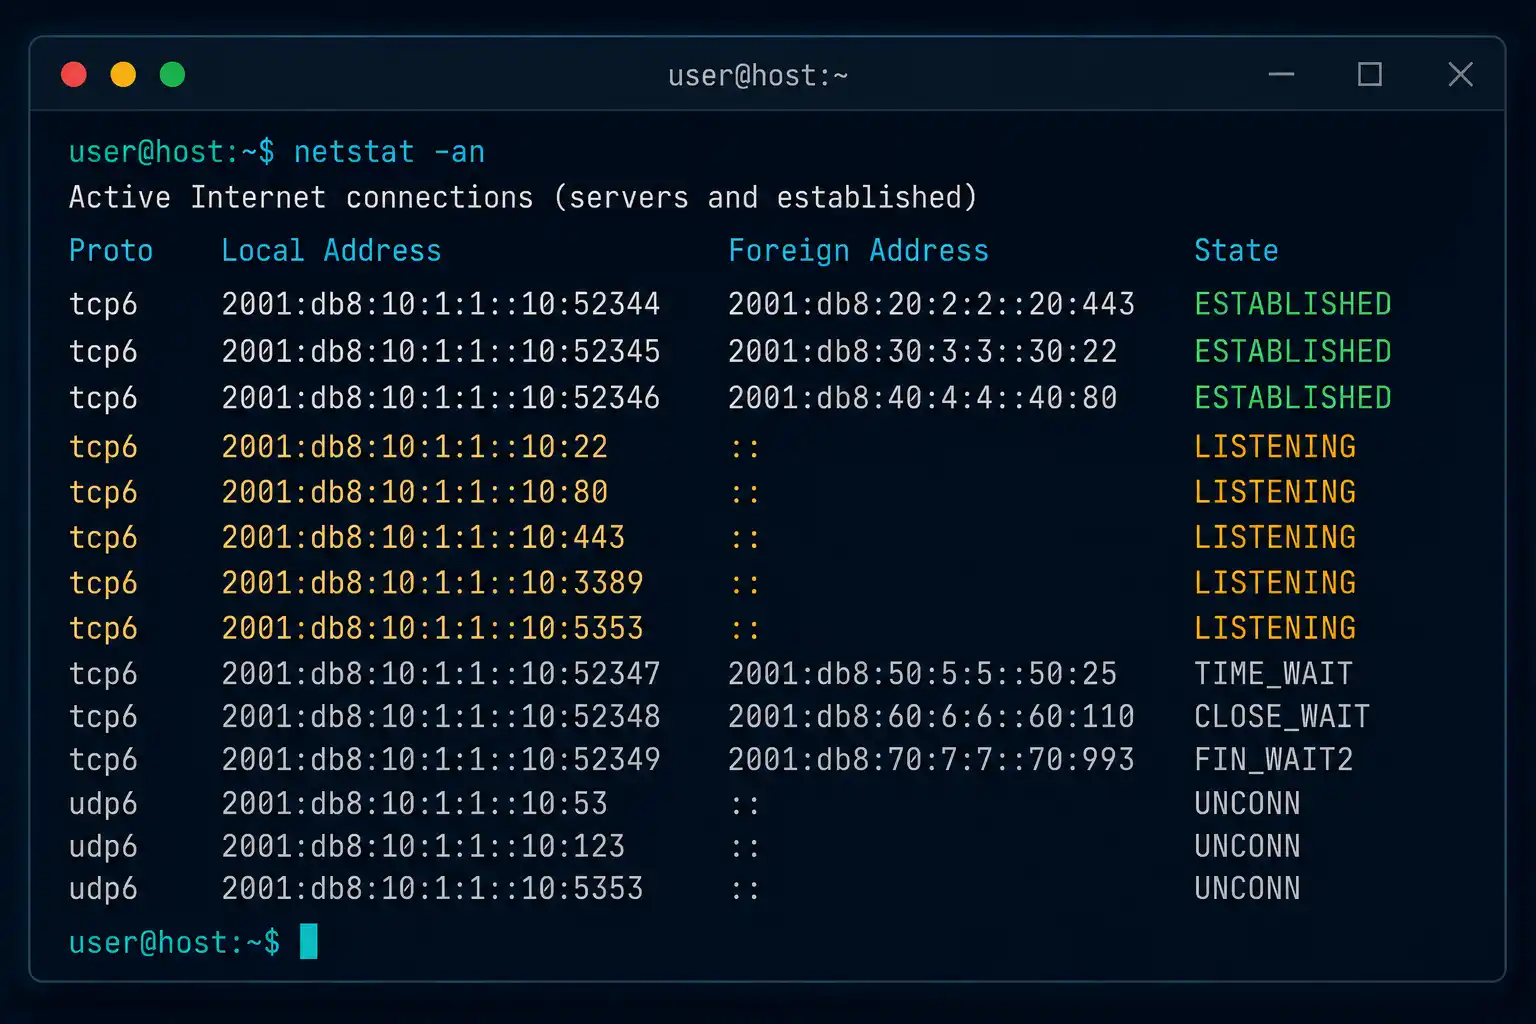
Knowing which TCP connections are active on a host is one of the fastest ways to catch a problem before it becomes an incident. An unexplained outbound connection can mean malware. A port stuck in the wrong state can mean a misbehaving application. The netstat command gives you visibility into both, on Windows and Linux alike.
This guide covers the full netstat switch reference, real command examples, the TCP connection states you’ll actually see, and how to troubleshoot netstat itself when it isn’t behaving. It also covers ss, the Linux replacement most modern distributions now ship by default.
Netstat shows you detailed information about individual connections, protocol-specific statistics, every listening port, and both incoming and outgoing traffic. By default it resolves IP addresses to domain names and port numbers to well-known application names, which is convenient for reading output but slower to run — a distinction that matters once you start using it for troubleshooting.
Running Netstat
Windows: Open Command Prompt (Win + R, type cmd, press Enter) and run:
netstat -anLinux: Open a terminal and run:
netstat -anIf netstat isn’t installed on your Linux distribution, install it with:
sudo apt install net-toolsOr use ss, the modern replacement that ships by default on most current distributions:
ss -tulnElevated privileges: Some switches, particularly -b on Windows, require administrator rights. On Windows, right-click Command Prompt and choose “Run as administrator.” On Linux, prefix the command with sudo:
sudo netstat -anCommand Syntax and Switch Reference
netstat [-a] [-b] [-e] [-f] [-n] [-o] [-p protocol] [-r] [-s] [-t] [-x] [-y] [interval] [/?]The table below reflects each switch’s actual, verified function. If you’ve seen a netstat reference elsewhere with descriptions that don’t match your own testing, this is why it’s worth double-checking against Microsoft’s documentation directly — switch tables for this command get miscopied online more often than you’d expect.
| Switch | Description |
|---|---|
-a | Displays all active connections and the TCP/UDP ports the computer is listening on. |
-b | Displays the executable filename involved in creating each connection or listening port. Requires administrator privileges and can noticeably slow execution. |
-e | Displays Ethernet statistics: bytes and packets sent/received, including unicast packets, non-unicast packets, discards, errors, and unknown protocols. Can be combined with -s. |
-f | Forces netstat to display Fully Qualified Domain Names (FQDNs) for foreign addresses where possible. |
-n | Displays addresses and port numbers numerically instead of resolving them to names. Significantly reduces execution time. |
-o | Displays the owning process ID (PID) for each connection. Cross-reference the PID against the Processes tab in Task Manager to identify the application. Can be combined with -a, -n, and -p. |
-p proto | Shows connections or statistics for a specific protocol only. Valid values: TCP, UDP, TCPv6, UDPv6. When combined with -s, also accepts icmp, ip, icmpv6, or ipv6. Use -s before -p when combining them. |
-r | Displays the IP routing table — equivalent to route print. |
-s | Displays per-protocol statistics. By default covers TCP, UDP, ICMP, and IP. If IPv6 is installed, also covers TCP over IPv6, UDP over IPv6, ICMPv6, and IPv6. |
-t | Displays the current TCP chimney offload state in place of the normal TCP state column. |
-x | Displays all NetworkDirect listeners, connections, and shared endpoints. |
-y | Displays the TCP connection template for all connections. Cannot be combined with other switches. |
[interval] | Redisplays statistics, pausing the specified number of seconds between each display. Runs until stopped with Ctrl+C. Default is to display once. |
/? | Displays help for the netstat command and its switches. |
Examples of the Netstat Command
Show FQDNs instead of IP addresses (Windows):
netstat -fThis shows all active TCP connections, resolving the foreign address to a domain name (for example, a connection to Google or Facebook) instead of a bare IP address where resolution succeeds. Only TCP connections appear in the Proto column with this switch; add -a if you also need UDP.
Numeric, all-connections view — the most common troubleshooting command:
netstat -anThis displays the protocol, local address and port, foreign address and port, and connection state for every active connection, without the delay of DNS resolution. This is the version you’ll use most often when triaging a live issue.
Save output to a file (Windows):
netstat -an > C:\logs\netstat_log.txtFilter for a specific port (Linux):
netstat -tuln | grep 80Requires net-tools to be installed. On distributions without net-tools, use ss instead:
ss -tuln | grep 80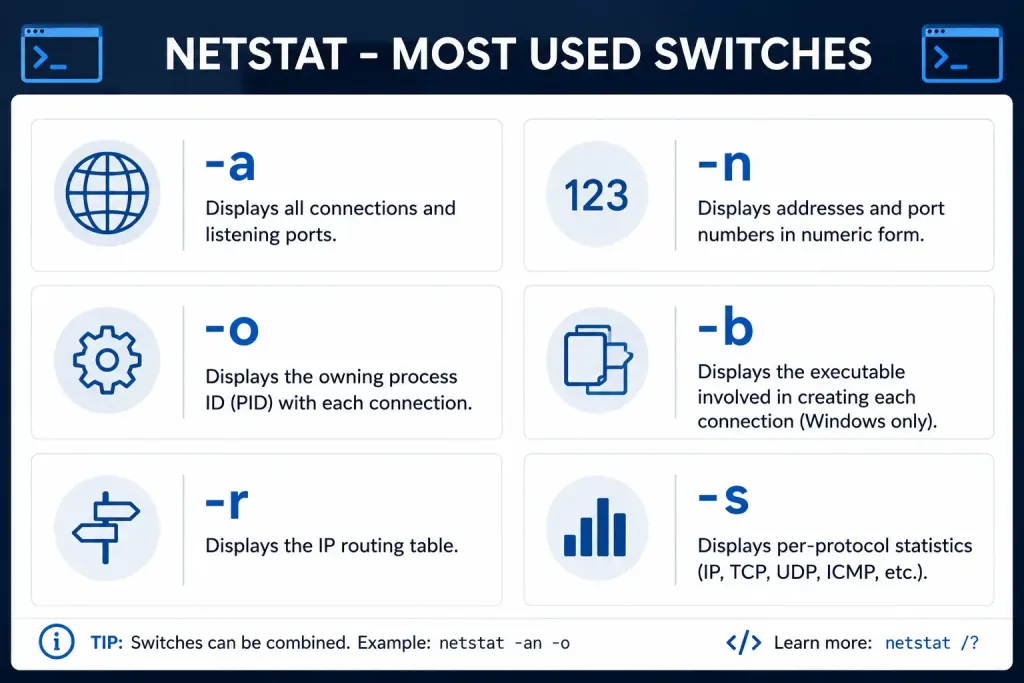
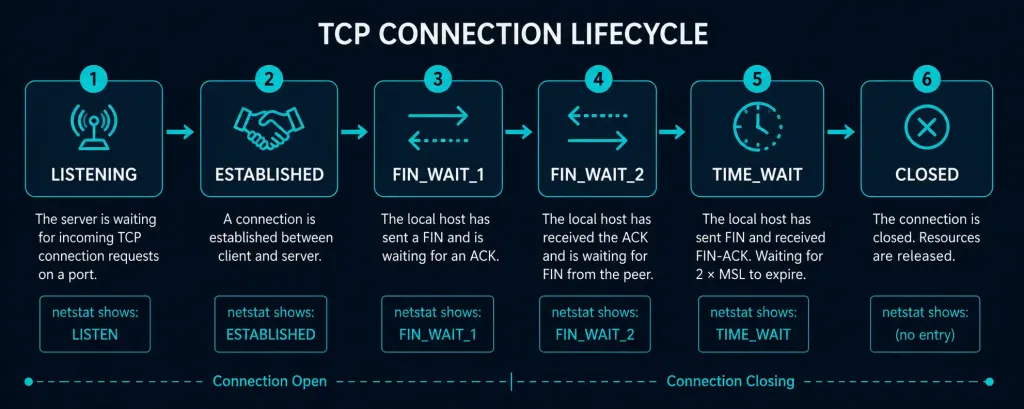
Detailed TCP Connection States
Understanding connection states is what turns raw netstat output into an actual diagnosis.
ESTABLISHED: An active, two-way data exchange is in progress — for example, a live web session on port 443. The connection stays in this state until either side closes it.
LISTENING: A service is waiting for incoming connections on a specific port, such as a web server on 192.168.1.100:443 waiting for HTTPS requests. A port you expect to be listening but isn’t usually points to a service that failed to start or is bound to the wrong interface.
TIME_WAIT: The connection has closed, but the operating system holds the socket for 2x the Maximum Segment Lifetime (MSL) — typically around 240 seconds (4 minutes) — to guarantee that no delayed packets from the old connection arrive and get misread as part of a new one. Large numbers of TIME_WAIT connections on a busy server are usually normal, not a problem.
CLOSE_WAIT: The remote side has closed the connection, and the local application needs to close its end too. A connection stuck in CLOSE_WAIT for a long time usually points to an application bug — the local process isn’t calling close() on the socket.
FIN_WAIT_1 / FIN_WAIT_2: Transitional states during an orderly connection shutdown, after the local side has sent a FIN packet requesting to close the connection.
Advanced Use Case: Monitoring a VPN Connection
To track PPTP connections on port 1723, filter netstat output for that port:
netstat -an | find "1723"This surfaces PPTP tunnel connections, such as a local endpoint at 192.168.1.100:5000 connecting to a remote endpoint at 115.110.0.150:1723. This is useful for confirming a VPN tunnel actually established, or for spotting unexpected PPTP traffic that shouldn’t be there.
Performance Considerations
Running netstat without -n forces it to resolve every foreign address to a hostname via DNS, which is the main reason a plain netstat command can feel slow on a host with many connections. Adding -n skips that resolution step entirely and returns numeric addresses immediately. The exact time saved depends on DNS response times, network conditions, and how many connections are open — it isn’t a fixed number, but on a host with dozens of active connections the difference is usually noticeable. If you want to benchmark it on your own system, time both versions directly:
time netstat -an
time netstat -a
Specific Threat Examples
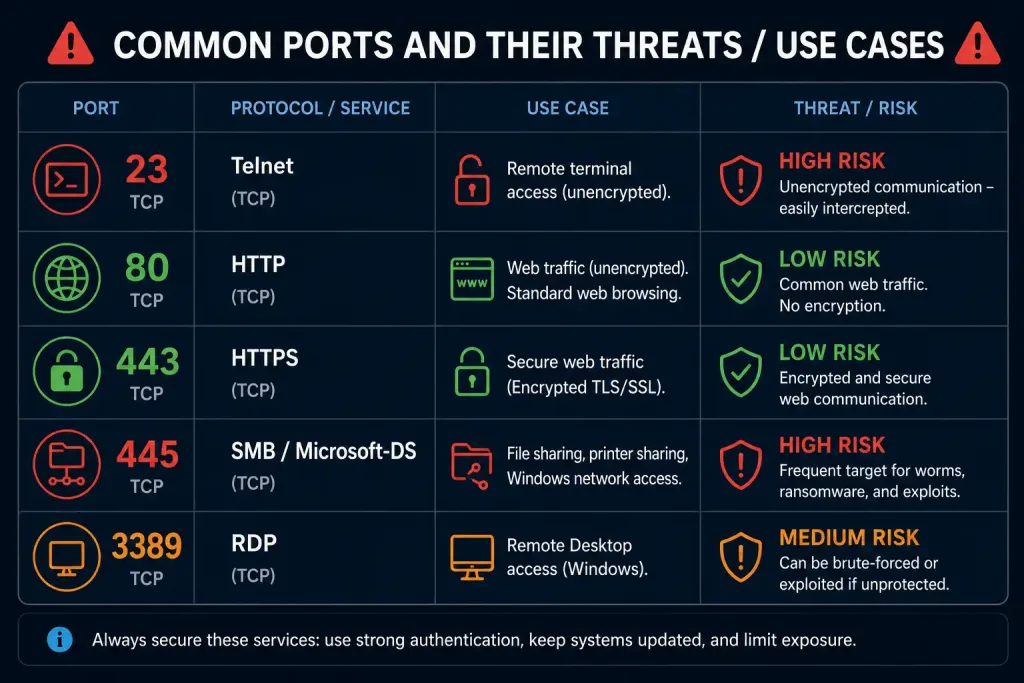
Port 445 (SMB): This port was the entry point for the WannaCry ransomware outbreak, which exploited the EternalBlue vulnerability in SMBv1. Detect active connections on this port with:
netstat -an | find "445"If SMB isn’t needed on a given host, block it at the firewall:
iptables -A INPUT -p tcp --dport 445 -j DROPPort 23 (Telnet): Telnet transmits credentials in plaintext and is a common brute-force target. Check for active Telnet connections with netstat -an | find "23", and disable the service entirely unless there’s a specific, secured reason to keep it running.
OS Compatibility Notes
Netstat remains fully supported on Windows and ships by default — it has not been deprecated. Microsoft does offer a more modern, object-oriented alternative in PowerShell: Get-NetTCPConnection for TCP and Get-NetUDPEndpoint for UDP. These return structured objects rather than plain text, which makes them easier to filter, sort, and script against, but netstat itself remains a normal, supported tool for day-to-day use.
On Linux, ss from the iproute2 package is the modern default on most current distributions and is generally faster than netstat on systems with large numbers of connections. Install it with:
sudo apt install iproute2Execution Security
Run netstat with elevated privileges to avoid permission errors and incomplete output — sudo netstat -an on Linux, or “Run as administrator” on Windows. If you’re logging connection data for later review, treat those logs the way you’d treat any other sensitive diagnostic data: restrict file permissions and consider encrypting them at rest, for example with Windows’ built-in EFS via cipher /e on the folder containing your logs.
Windows vs. Linux Netstat: Key Differences
The core idea behind netstat is the same on both platforms, but the switches and default behavior differ enough to trip people up when they move between environments.
| Factor | Windows | Linux |
|---|---|---|
| Show all connections | netstat -a | netstat -a or ss -a |
| Numeric output (skip DNS) | netstat -n | netstat -n or ss -n |
| Show owning process | netstat -o (PID only, cross-reference Task Manager) | netstat -p (shows process name directly) |
| Show routing table | netstat -r | netstat -r or ip route |
| Modern replacement tool | PowerShell Get-NetTCPConnection | ss (iproute2) |
| Default availability | Included with Windows | May require installing net-tools; ss is usually preinstalled |
If you’re scripting against netstat output across both platforms, this is the table worth keeping on hand — the switch letters overlap just enough to be confusing when they don’t behave identically.
Troubleshooting Netstat Itself
Windows: If netstat fails to run or produces no output, confirm it hasn’t been removed or corrupted by a system change, or use the PowerShell alternative: Get-NetTCPConnection.
Linux: If netstat isn’t found, install it with sudo apt install net-tools, or switch to ss, which is preinstalled on most modern distributions.
FAQs
What is the purpose of the netstat command?
Netstat displays active TCP and UDP connections, listening ports, and per-protocol statistics on both Windows and Linux. It’s one of the fastest ways to confirm whether a service is actually listening on the port you expect, and to spot unexplained outbound connections that might indicate a security problem.
How do I list all TCP connections?
On Windows, open Command Prompt and run netstat -an. On Linux, use netstat -an in a terminal, or ss -tuln if ss is available. Adding -n to either command skips DNS resolution and returns results immediately, which matters when a host has a large number of active connections.
What does the -o switch do?
On Windows, -o adds the owning process ID (PID) to each connection in the output, which you can then look up in Task Manager’s Processes tab to identify the responsible application. This switch is Windows-specific; the standard Linux netstat build doesn’t include a direct equivalent, though -p on Linux serves a similar purpose by showing the process name directly.
How can I resolve IP addresses to FQDNs?
On Windows, netstat -f forces domain-name resolution for foreign addresses where DNS lookup succeeds. This isn’t a switch on standard Linux netstat builds; on Linux, omitting -n from your command triggers the equivalent hostname resolution automatically.
What are the most common TCP connection states?
The states you’ll see most often are ESTABLISHED (an active session), LISTENING (a service waiting for connections), TIME_WAIT (a recently closed connection held open briefly to catch delayed packets), and CLOSE_WAIT (a connection where the remote side has closed but the local application hasn’t yet). All four are visible with netstat -an on both Windows and Linux.
How can I automate netstat monitoring?
On Windows, a batch script with a loop can call netstat -an at intervals and append the output to a log file. On Linux, a bash script using a while loop with sleep between iterations accomplishes the same thing. For continuous monitoring without scripting your own loop, netstat’s built-in [interval] parameter will redisplay statistics automatically until you stop it with Ctrl+C.
What security risks does netstat help identify?
Netstat helps you catch unauthorized or unexpected connections on sensitive ports — SMB (445), Telnet (23), and RDP (3389) are common targets worth checking regularly. Spotting an unexpected LISTENING or ESTABLISHED state on one of these ports is often the first sign of a compromised host, and combining netstat with -b or -o lets you trace the connection back to the responsible process.