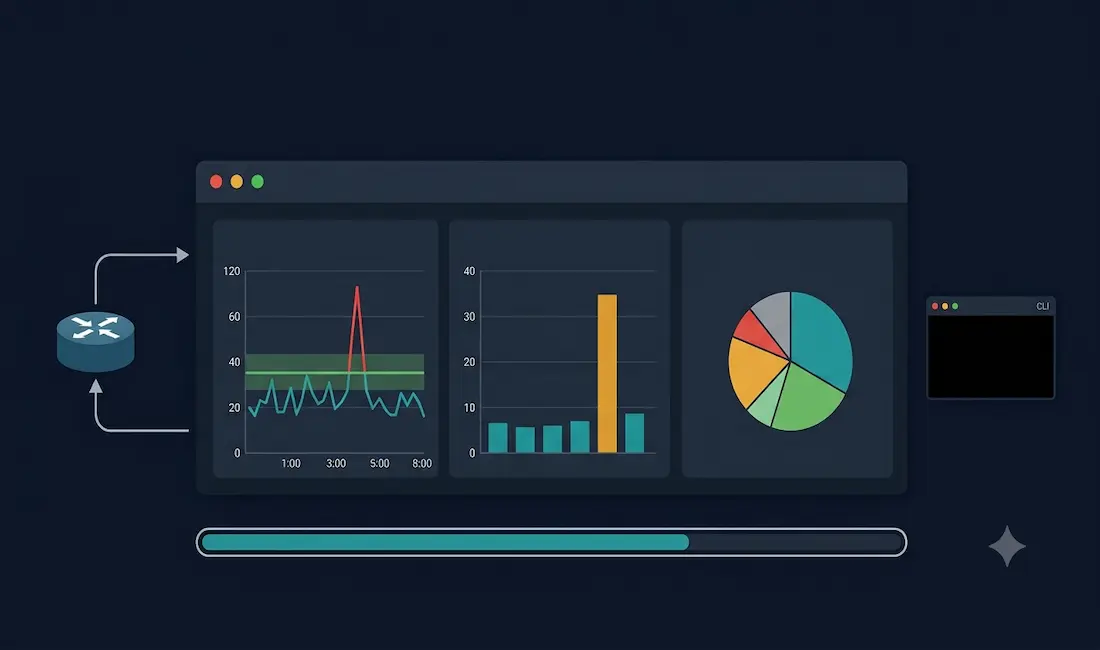
Do you know your standard network throughput volume and the types of traffic used in your network? If you cannot answer those questions with specific numbers, you need a network baseline. A network baseline is one of the most valuable tools available to network administrators for monitoring performance, detecting anomalies, and troubleshooting problems before they affect users.
This guide covers what a network baseline is, what metrics to capture, when to establish one, how to build one step by step, which tools to use, how to interpret the results, and what CCNA candidates need to know about the topic.
What Is a Network Baseline?
A network baseline is a documented record of normal network behavior captured during a known-good period of operation. It establishes a performance reference point — a snapshot of what the network looks like when everything is working as expected — against which future measurements can be compared.
When a problem is reported, the baseline answers the most important diagnostic question: “Is this behavior normal or abnormal for this network?” Without a baseline, an administrator has no objective reference. With one, deviations from expected behavior become immediately visible and quantifiable.
A network baseline typically captures:
- Bandwidth utilization per interface, per segment, and per application
- Latency (round-trip time) between key network points
- Packet loss rates across critical paths
- Protocol distribution (what percentage of traffic is TCP, UDP, HTTP, DNS, etc.)
- CPU and memory utilization on routers, switches, and servers
- Error rates on interfaces (CRC errors, late collisions, input/output drops)
- Top talkers — devices generating the most traffic
- Traffic patterns across the business day, week, and month
Why a Network Baseline Matters
For an effective network, a baseline performance record is required over time. Measuring performance at varying times and loads helps create a more complete picture of overall network performance. Without this reference, administrators face several problems:
Troubleshooting in the dark — without knowing what “normal” looks like, it is impossible to determine whether a complaint about slow performance reflects a real degradation or just a user’s perception. A baseline makes this distinction objective.
No evidence for capacity planning — decisions about when to upgrade bandwidth, add switches, or expand WAN circuits should be driven by measured utilization trends, not estimates. A baseline provides the data.
Security blind spots — many network intrusions and malware infections are first visible as anomalies in traffic patterns — sudden spikes in DNS traffic, unexpected protocol distribution changes, or new large flows between hosts that don’t normally communicate. A baseline is the reference that makes these anomalies detectable.
Change management risk — when a configuration change is made, comparing pre- and post-change baselines confirms whether the change had the intended effect and whether it introduced any unintended performance impacts.
When to Establish a Network Baseline
Timing matters for baseline quality. The goal is to capture traffic patterns that are truly representative of normal operations — not periods distorted by unusual events.
Best times to baseline:
- At network commissioning — immediately after a new network or segment goes live and is confirmed working correctly
- Before planned changes — to provide a pre-change reference for comparison
- After planned changes — to confirm the change had the intended effect
- At regular intervals — quarterly or semi-annually for stable networks; monthly for rapidly evolving environments
- During known-good periods of normal business activity
Times to avoid:
- During known anomalous periods (end-of-quarter processing, annual backups, scheduled batch jobs)
- Immediately after a network incident
- During holidays or low-traffic periods that do not represent normal load
- During peak events that are not representative of typical daily patterns (unless that peak is itself what you need to document)
Minimum baseline duration: A single day of capture is almost never sufficient. The minimum recommended period is 7 days to capture a full weekly cycle, including both business days and weekend patterns. A 4 to 6-week baseline provides a more representative picture of monthly variation and is the standard for commercial network environments. For networks with strong seasonal patterns (retail, education, government), quarterly baselines may be needed to capture all meaningful traffic patterns.
What Metrics to Capture in a Network Baseline
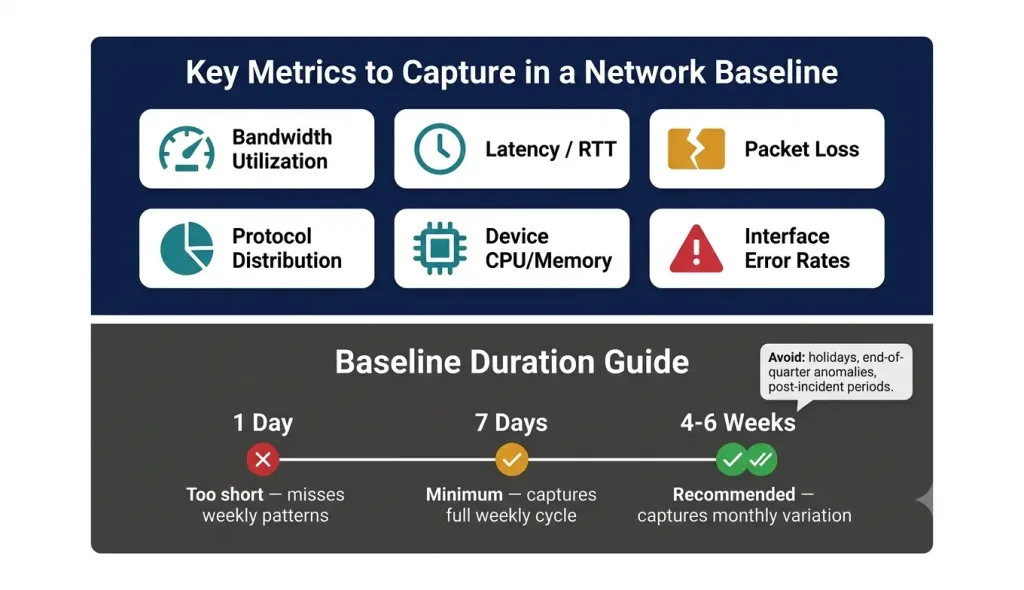
The specific metrics depend on the network size and purpose, but the following are standard for most enterprise and campus environments:
Interface-Level Metrics
- Bandwidth utilization — percentage of interface capacity used, measured at average and peak
- Packet counts — input and output packets per second
- Error counters — CRC errors, input errors, output drops, late collisions (from
show interfaces) - Interface state — up/down history and flap frequency
End-to-End Path Metrics
- Latency (RTT) — round-trip time between key hosts, measured with ping
- Jitter — variation in latency over time (critical for voice and video)
- Packet loss — percentage of packets lost on key paths
- Traceroute hop count and per-hop latency — path consistency across measurement periods
Application and Protocol Metrics
- Protocol distribution — breakdown of traffic by protocol (TCP/UDP, HTTP/S, DNS, SMTP, VoIP, etc.)
- Top applications — which applications consume the most bandwidth
- Top talkers — which hosts generate the most traffic
- DNS query rate — unusually high rates can indicate malware
Device-Level Metrics
- CPU utilization — measured on routers and switches during normal and peak periods
- Memory utilization — available memory on network devices
- Interface error rates — from SNMP polling or
show interfacesoutput
Traffic Pattern Metrics
- Daily traffic profile — hour-by-hour bandwidth utilization chart across a business day
- Weekly traffic profile — day-by-day utilization across a full week
- Peak vs average utilization — the ratio between highest recorded utilization and the average
How to Establish a Network Baseline: Step by Step
Step 1 — Define the Scope
Identify which network segments, devices, and paths the baseline will cover. For a complete enterprise baseline, this typically includes:
- All WAN interfaces
- Core and distribution layer switch uplinks
- Key server farm segments
- Critical host-to-host paths (workstation to DNS, workstation to file server, remote site to headquarters)
Document the scope in writing before starting data collection.
Step 2 — Select Your Tools
Choose tools appropriate to your environment and budget. See the Tools section below for a full comparison. For a manual baseline on a small network, ping, traceroute, and show interfaces commands capture core data. For larger environments, dedicated NMS (Network Management System) software automates collection across all devices simultaneously.
Step 3 — Collect Data During a Normal Business Period
Run measurements continuously for a minimum of 7 days. For each interface and path in scope:
- Poll SNMP counters every 5 minutes (standard interval for most NMS tools)
- Capture ping statistics to key hosts at regular intervals
- Run
tracerouteto document the path from key source-destination pairs
Save all results with timestamps. The network administrator can copy, paste, and save the results from an executed ping, trace, and other related commands into a text file with time and date. These timestamped text files become the reference dataset for future comparisons.
Step 4 — Document the Results
Produce a baseline report covering:
- Average and peak bandwidth utilization per interface
- Average and peak latency per key path
- Protocol distribution at the time of capture
- Device CPU and memory at average and peak load
- Error counter values at the start of the baseline period (for comparison)
- Any known anomalies during the capture period that should be excluded from the reference
Step 5 — Store and Version Control the Baseline
Store baseline reports in a central location accessible to the network team. Include the date range, network scope, tools used, and the person responsible. When the next baseline is taken, keep the previous version for historical trend analysis — a single baseline tells you where you are; multiple baselines over time tell you whether the network is growing, degrading, or stable.
Step 6 — Compare Against the Baseline During Troubleshooting
When a performance problem is reported, the first step is to compare current measurements against the baseline. The figures below illustrate the result of the ping command for the same IP address with different timings and the comparison of both. If response times in the current measurement are massively higher than the baseline, there is a latency issue to address. If packet loss appears where the baseline shows zero loss, the path has degraded. If bandwidth utilization is 95% where the baseline showed 45%, capacity planning is overdue.
How to Use Ping and Traceroute for Manual Baselines
For small networks or as a supplement to automated tools, ping and traceroute are effective manual baselining tools.
Interpreting Ping Baseline Results
A healthy ping baseline to a local host shows:
Reply from 192.168.1.2: bytes=32 time=1ms TTL=128
Reply from 192.168.1.2: bytes=32 time=1ms TTL=128
Reply from 192.168.1.2: bytes=32 time=1ms TTL=128
Reply from 192.168.1.2: bytes=32 time=1ms TTL=128

Ping statistics for 192.168.1.2:
    Packets: Sent = 4, Received = 4, Lost = 0 (0% loss)
Approximate round trip times in ms:
    Minimum = 1ms, Maximum = 2ms, Average = 1ms
A later measurement showing increased RTT indicates a latency problem:
Reply from 192.168.1.2: bytes=32 time=28ms TTL=128
Reply from 192.168.1.2: bytes=32 time=35ms TTL=128
Reply from 192.168.1.2: bytes=32 time=31ms TTL=128

Approximate round trip times in ms:
    Minimum = 28ms, Maximum = 35ms, Average = 31ms
A jump from 1ms average to 31ms average to a locally connected host indicates a significant problem — likely interface congestion, a duplex mismatch, or a spanning-tree issue on the local segment. The baseline makes this quantifiable: without the reference value, the 31ms reading has no context.
Cisco IP SLA for Automated Baselining
For Cisco environments, IP SLA (Service Level Agreement) is a built-in IOS feature that automates continuous measurement of latency, jitter, and packet loss between network points without requiring additional software.
Basic IP SLA configuration for latency baselining:
Router(config)# ip sla 1
Router(config-ip-sla)# icmp-echo 192.168.1.2
Router(config-ip-sla)# frequency 60
Router(config-ip-sla)# exit
Router(config)# ip sla schedule 1 start-time now life forever
Verify results:
Router# show ip sla statistics 1IP SLA runs continuously in the background, building a historical dataset of RTT measurements that forms a precise quantitative baseline for WAN link and inter-site latency.
Baselining Tools: Comparison
The network administrator needs software to baseline a network. Both Colasoft nChronos and Capsa listen to packet data from wires and generate various reports on the network. Beyond these, several other tools are widely used in professional environments:
| Tool | Type | Best For | Cost |
|---|---|---|---|
| Colasoft nChronos | Packet capture + analysis | Deep packet inspection, protocol analysis | Commercial |
| Colasoft Capsa | Network analyzer | Real-time traffic analysis, protocol distribution | Commercial |
| PRTG Network Monitor | SNMP / flow-based NMS | All-in-one monitoring for SMB to enterprise | Freemium / Commercial |
| SolarWinds NTA | NetFlow analyzer | Flow-based traffic analysis, top talkers | Commercial |
| Wireshark | Packet analyzer | Deep inspection, manual capture and analysis | Free / Open Source |
| Cisco IP SLA | Built-in IOS feature | Automated latency, jitter, packet loss measurement | Built into IOS |
| NetFlow / IPFIX | Flow protocol | Traffic volume and protocol distribution at scale | Requires collector |
| Zabbix | Open-source NMS | SNMP polling, interface utilization, device health | Free / Open Source |
| Nagios | Open-source NMS | Availability monitoring, threshold alerting | Free / Open Source |
| ntopng | Flow analysis | Web-based real-time and historical flow analysis | Freemium |
For small networks: Wireshark for packet-level inspection, combined with ping, traceroute, and show interfaces output saved to text files, provides a functional manual baseline at no cost.
For mid-sized networks: PRTG or Zabbix with SNMP polling automates collection across all devices. PRTG’s free tier covers up to 100 sensors.
For enterprise networks: SolarWinds NTA, Cisco Prime Infrastructure, or dedicated NetFlow collectors with long-term storage provide the depth of historical data needed for trend analysis and capacity planning.
Common Uses of a Network Baseline
We can use the network baseline as listed below:
- Evaluate network management policies agreement — verify that current traffic patterns comply with acceptable use policies and QoS policies
- Understand network patterns and traffic trends — identify seasonal patterns, growth rates, and shifts in application mix over time
- Speed up troubleshooting network problems — compare current measurements to baseline reference values to quickly identify deviations
- Understand network resource allocation — determine which segments and devices are underutilized and which are approaching capacity
- Provide network upgrade history statistics — document pre- and post-upgrade performance to demonstrate the impact of infrastructure investments
- Provide data for decision-making as well as for network and security management — support budget requests, capacity planning decisions, and security incident investigation with objective measurement data
CCNA Exam Pointers
- A network baseline establishes a reference point of normal network behavior
- Baselines are used to detect deviations from normal performance during troubleshooting
- The recommended minimum baseline period is 7 days to capture a full weekly cycle
- Baselines should be captured during known-good, normal business operation periods
- Key metrics include bandwidth utilization, latency (RTT), packet loss, error rates, and protocol distribution
- Cisco IP SLA is the built-in IOS tool for automated latency and jitter measurement
show interfacesprovides error counters for interface-level baseline datapingandtracerouteoutput saved with timestamps constitute a basic manual baseline- Baselines support capacity planning, troubleshooting, change management, and security monitoring
- The CCNA exam may ask: “When should an administrator establish a network baseline?” — the answer is during a known-good period before changes, and at regular intervals for ongoing monitoring
Conclusion
A network baseline is not a one-time task — it is an ongoing practice that gives network administrators the objective reference needed to manage performance, plan capacity, respond to incidents, and demonstrate the impact of infrastructure changes. The baseline’s value compounds over time: a single baseline tells you where the network is today; a series of baselines over months and years reveals growth trends, degradation patterns, and the long-term effects of design decisions.
For CCNA candidates, understanding what a baseline is, what it captures, when to take one, and how to use it for troubleshooting is directly testable knowledge. For working administrators, it is one of the most practical skills in the discipline.
Start simple — ping, traceroute, and show interfaces output saved with timestamps is a baseline. As the network grows, automated SNMP polling, NetFlow collection, and dedicated NMS tools extend the baseline’s depth and usefulness proportionally.
Frequently Asked Questions
What is a network baseline and why is it important?
A network baseline is a documented record of normal network performance and behavior captured during a known-good period of operation. It establishes the reference point against which future measurements are compared to detect deviations. Without a baseline, a network administrator has no objective standard for determining whether a reported performance problem represents a real degradation or normal behavior. A baseline is important for troubleshooting (comparing current to normal), capacity planning (tracking utilization trends over time), security monitoring (detecting anomalous traffic patterns), and change management (verifying that configuration changes had the intended effect without introducing new problems).
When should an administrator establish a network baseline?
A network baseline should be established at network commissioning (immediately after a new network goes live and is confirmed working correctly), before planned configuration changes (to provide a pre-change reference), after planned changes (to verify the outcome), and at regular intervals for ongoing monitoring — quarterly or semi-annually for stable networks, monthly for rapidly evolving environments. The baseline capture period should occur during normal business operations — not during holidays, end-of-quarter anomalies, or other periods that do not represent typical daily patterns. A minimum of 7 days is recommended to capture a full weekly traffic cycle; 4–6 weeks is standard for commercial network environments.
What metrics should be included in a network baseline?
A comprehensive network baseline captures: bandwidth utilization per interface (average and peak), latency (round-trip time) between key network points, packet loss rates across critical paths, jitter (variation in latency, critical for voice and video), protocol distribution (breakdown by application and protocol type), top talkers (devices generating the most traffic), CPU and memory utilization on routers and switches, and interface error counters (CRC errors, input errors, output drops, late collisions). The specific metrics included depend on the network’s size, purpose, and the applications it carries, but bandwidth utilization and latency are the minimum that any meaningful baseline should document.
What tools are used to establish a network baseline?
Tools range from free built-in utilities to commercial enterprise platforms. For manual baselines on small networks, ping, traceroute, and show interfaces output saved to timestamped text files provide basic reference data. Colasoft nChronos and Capsa provide packet-level capture and analysis for deeper protocol inspection. PRTG Network Monitor and Zabbix automate SNMP polling for interface utilization and device health across medium-sized networks. SolarWinds NTA and similar NetFlow collectors handle flow-based traffic analysis at scale. For Cisco IOS networks, the built-in IP SLA feature automates continuous measurement of latency, jitter, and packet loss between configured measurement points without additional software or hardware.
How is a network baseline used during troubleshooting?
When a performance complaint is received, the troubleshooting process begins by taking current measurements of the same metrics captured in the baseline — ping RTT to the affected hosts, traceroute to verify path consistency, interface utilization from SNMP or show commands, and error counters. These current values are then compared against the baseline reference. If latency to a host has increased from a baseline of 1ms to a current measurement of 35ms, the magnitude and location of the degradation are immediately quantifiable. If bandwidth utilization is at 95% where the baseline showed 45%, the root cause is likely congestion. If error counters are incrementing where the baseline showed zero, a physical or configuration problem has been introduced. The baseline converts a vague complaint into a measurable, diagnosable deviation.