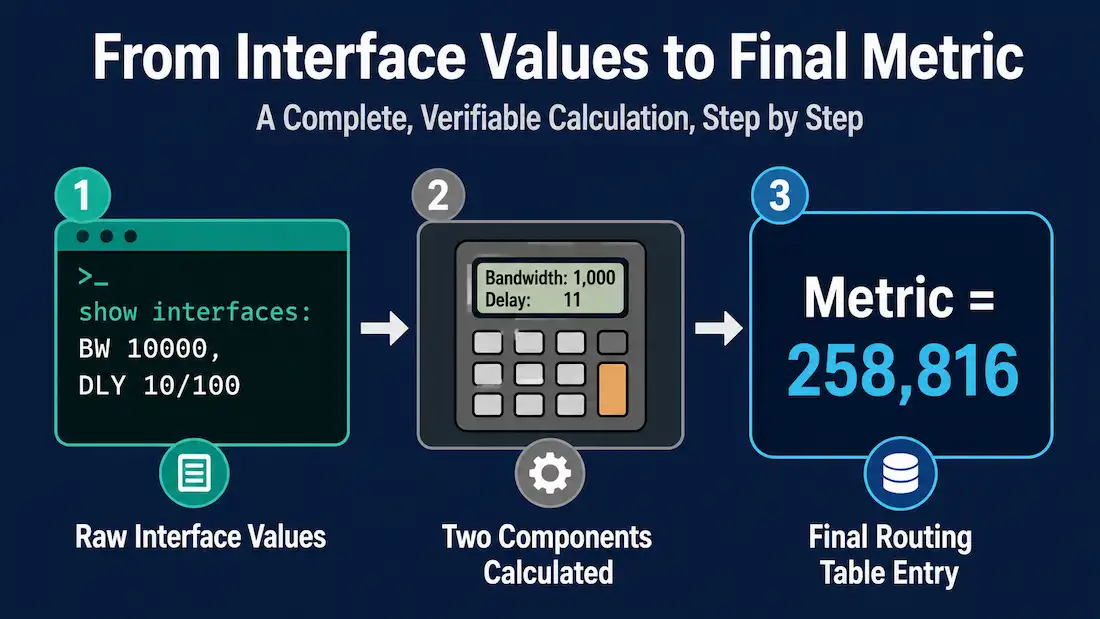
EIGRP automatically calculates the routing table metric to choose the best path, but understanding exactly how that number gets produced turns an abstract routing table entry into something you can verify by hand. This guide works through a complete, real calculation step by step, using a topology consistent with the rest of this site’s EIGRP series, and then applies the same process to a second, longer-path example to show how the calculation scales.
This complements EIGRP Composite Metric, which covers the full formula and K-values in depth — this guide focuses specifically on walking through one concrete calculation from raw interface values to the final routing table entry.
The Default Formula
With EIGRP’s default K-values (K1=1, K3=1, everything else 0), the composite metric formula simplifies to:
Metric = [Bandwidth + Delay] × 256Where Bandwidth is 10,000,000 divided by the slowest interface bandwidth (in kbps) anywhere along the path, and Delay is the sum of every interface’s delay value along the path, divided by 10 to convert from raw microseconds into the tens-of-microseconds units the formula actually uses.
The Three Steps
After examining the bandwidth and delay values for every outgoing interface along the route:
- Find the slowest bandwidth along the path and calculate its contribution using
10,000,000 / bandwidth. - Sum the delay values for every outgoing interface on the way to the destination, then divide the total by 10.
- Multiply the sum of the bandwidth and delay components by 256. The bandwidth and delay components together produce a 24-bit value, but EIGRP’s metric field is 32 bits — multiplying by 256 (2⁸) shifts the value into the correct 32-bit range.
Worked Example: Calculating the Metric for 192.168.2.0/24
This example uses the same topology referenced throughout this site’s EIGRP series, calculating the metric R1 would install in its routing table for the 192.168.2.0/24 network, reached via R2 and R3.
Step 1: Find the Bandwidth Component
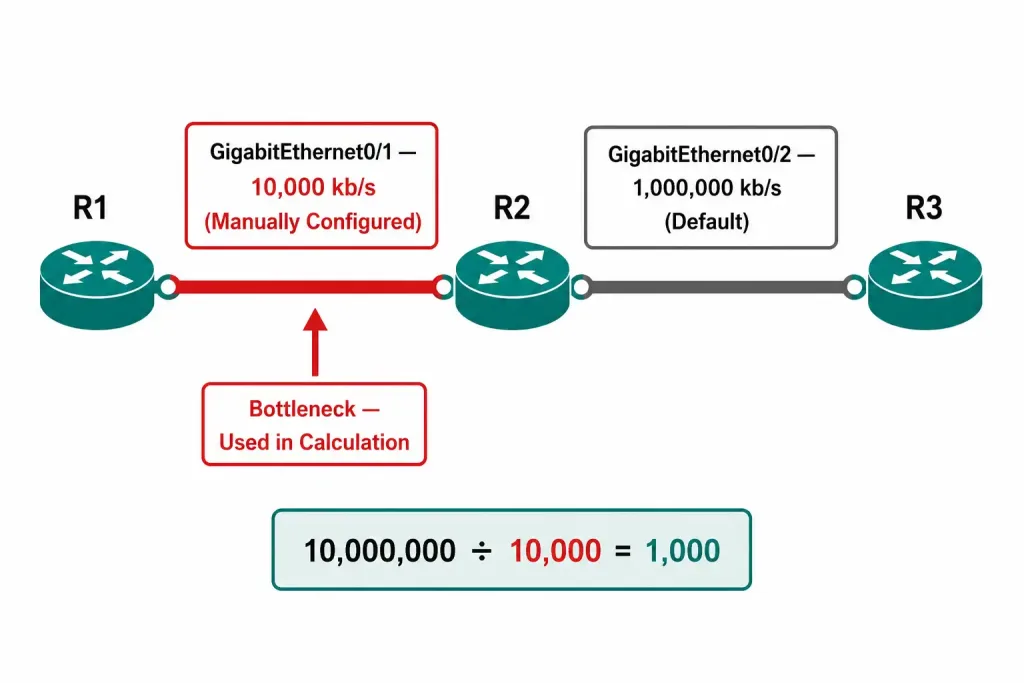
Examining each interface along the path from R1 to the destination network: the GigabitEthernet0/1 interface on R1 has been manually configured with a bandwidth of 10,000 kb/s — this is not the default bandwidth for a Gigabit interface, but an explicit configuration, which matters because it changes which link is actually the bottleneck. The GigabitEthernet0/2 interface on R3, by contrast, is left at its default of 1,000,000 kb/s.
Comparing the two, R1’s configured 10,000 kb/s is the slowest link along the path, so that’s the value used:
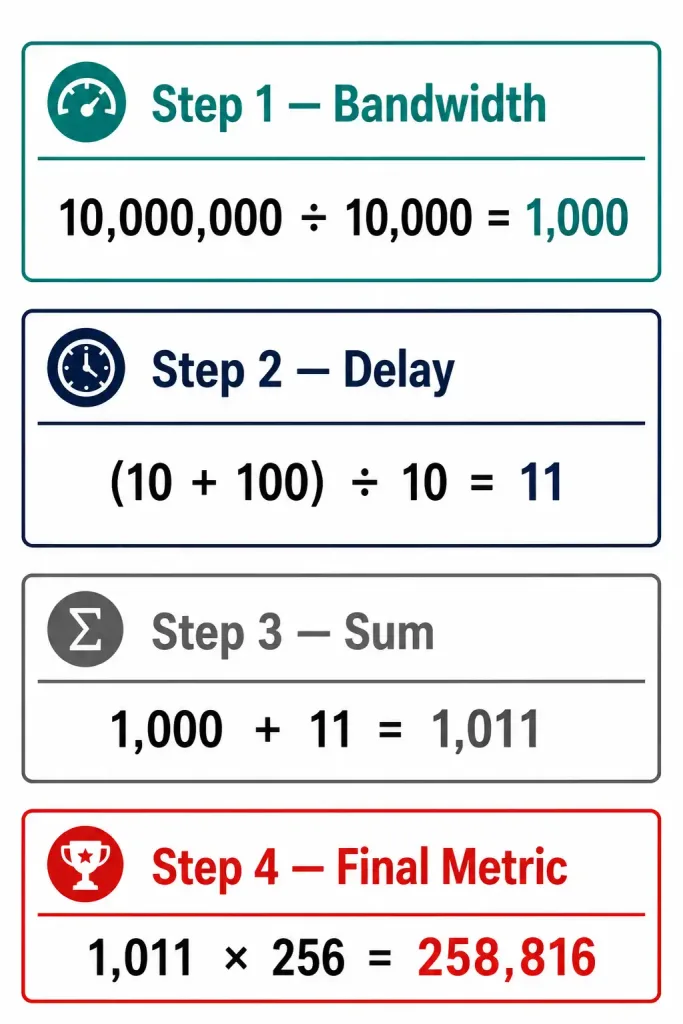
Bandwidth component = 10,000,000 / 10,000 = 1,000(If the division doesn’t produce a whole number, the result is rounded down.)
Step 2: Find the Delay Component
Using the same outgoing interfaces: R1’s GigabitEthernet0/1 has a delay value of 10 microseconds — the standard default for a Gigabit interface. R3’s GigabitEthernet0/2 has a delay value of 100 microseconds, reflecting a configuration on that specific link rather than the Gigabit default.
Summing the delays along the path and dividing by 10 to get the value in the units EIGRP’s formula actually uses:
Delay component = (10 + 100) / 10 = 11Step 3: Calculate the Final Metric
With both components calculated, apply the simplified default formula:
Metric = [Bandwidth + Delay] × 256
       = [1,000 + 11] × 256
       = 1,011 × 256
       = 258,816
This is exactly the value that would appear in R1’s routing table for the 192.168.2.0/24 route, visible with show ip route:
R1# show ip route
...
D    192.168.2.0/24 [90/258816] via 10.10.10.6, GigabitEthernet0/1
The bracketed pair [90/258816] shows the administrative distance (90, EIGRP’s internal default) followed by the computed metric — the exact number this worked example just derived by hand.
A Second Worked Example: A Longer Path
The three-step process holds identically regardless of how many hops a path involves — only the number of interfaces contributing to the delay sum changes. Consider a four-hop path where the slowest link along the way is a Serial interface at 1,544 kbps (a T1), and the path passes through four interfaces total with delays of 20,000, 20,000, 100, and 100 microseconds respectively.
Step 1 — Bandwidth:
Bandwidth component = 10,000,000 / 1,544 = 6,476 (rounded down)Step 2 — Delay:
Sum of delays = 20,000 + 20,000 + 100 + 100 = 40,200 microseconds
Delay component = 40,200 / 10 = 4,020
Step 3 — Final metric:
Metric = [6,476 + 4,020] × 256 = 10,496 × 256 = 2,686,976Comparing this to the first worked example is instructive: even though this path involves more hops, its dramatically higher delay component (driven by two links with 20,000-microsecond delay, typical of a slower WAN-class interface) pushes the final metric far higher than the single-bottleneck example above, despite covering the same conceptual three steps. This is exactly the kind of comparison worth running by hand when trying to understand why EIGRP prefers one path over another in a real topology with more than one viable route — the raw hop count alone tells you very little about which path will actually win.
Verifying the Calculation on a Live Router
Beyond show ip route, two additional commands help confirm a calculation like this matches what the router actually computed, rather than relying solely on the summary view:
R1# show ip eigrp topology 192.168.2.0/24This shows the Feasible Distance for the specific route, along with the Reported Distance from the next-hop neighbor — useful for confirming the final metric independently of the routing table summary view.
R1# show interfaces GigabitEthernet0/1Confirms the actual BW and DLY values currently configured on the interface, which is the starting point for the entire calculation — if a manual calculation doesn’t match the router’s actual output, checking these raw values first is the fastest way to spot a wrong input before assuming the formula itself was misapplied or that something deeper is wrong with the routing process.
Common Mistakes
Using the wrong interface’s bandwidth. The calculation depends on finding the single slowest bandwidth anywhere along the entire path, not the bandwidth of the local outgoing interface alone. In multi-hop topologies, it’s easy to check only the first hop and miss a slower link further along the path.
Forgetting to divide delay by 10. The raw delay values shown in show interfaces are in microseconds, but the formula operates in tens of microseconds. Summing raw microsecond values without dividing by 10 produces a metric ten times too large, which can look plausible enough to go unnoticed unless checked directly against a router’s actual output.
Assuming every Gigabit interface has the same delay. As this worked example shows, R3’s Gigabit interface has a delay of 100 microseconds rather than the typical Gigabit default of 10 — a sign it was explicitly configured differently, not a mistake in the example. Always check the actual configured value with show interfaces rather than assuming a default applies, especially when reconciling a hand calculation against a router’s real output.
Forgetting the final ×256 multiplication. It’s a common slip to correctly calculate the bandwidth and delay components, add them together, and then report that sum as the final metric — forgetting the multiplication by 256 that converts the 24-bit intermediate value into EIGRP’s actual 32-bit metric field.
Troubleshooting Scenarios Using This Calculation
A few situations where working through the calculation by hand solves a real problem:
A route’s metric is unexpectedly high. Rather than assuming a topology problem, calculate the expected metric by hand from the interfaces along the path and compare it against show ip route. A mismatch between the expected and actual value usually points to an interface with a stale or misconfigured bandwidth or delay statement somewhere along the path — often one that was never intended to reflect the values it currently has, left over from an earlier configuration or copied from a different link entirely.
Two paths to the same destination have surprisingly close metrics. Working through both calculations by hand, side by side, often reveals that one path’s advantage in bandwidth is being offset almost exactly by the other path’s advantage in delay — exactly the kind of interaction that’s easy to miss when only looking at the final routing table value, but obvious once both components are broken out separately and compared directly against each other.
A bandwidth or delay command change doesn’t seem to affect the metric. If a change was made on an interface that isn’t actually the path’s bottleneck (for bandwidth) or doesn’t lie along the specific path being examined (for delay), the metric won’t reflect it. Recalculating by hand, starting from show interfaces on every interface along the actual path, confirms whether the changed interface was ever actually relevant to this specific route’s calculation in the first place, rather than assuming the command itself failed to take effect.
Frequently Asked Questions
Why does EIGRP use the slowest bandwidth along the entire path rather than an average?
Because the slowest link is the actual bottleneck — no amount of bandwidth on other segments of the path can make traffic move faster than the single slowest link allows. Using the minimum, rather than an average, correctly reflects the path’s real limiting factor.
Why is the delay component divided by 10?
Because show interfaces reports delay in raw microseconds, but EIGRP’s composite metric formula was defined to operate in units of tens of microseconds. Dividing the summed delay by 10 converts it into the units the formula actually expects.
What does the ×256 at the end of the formula actually accomplish?
It converts a 24-bit intermediate value (the sum of the bandwidth and delay components) into EIGRP’s full 32-bit metric field. Multiplying by 256, which is 2⁸, is mathematically equivalent to shifting the value left by 8 bits.
Why is R1’s GigabitEthernet0/1 bandwidth 10,000 kb/s instead of the default 1,000,000?
Because it’s been manually configured with the bandwidth command, overriding the interface’s default. This is common in labs and real deployments specifically to influence EIGRP path selection without needing to physically change the link’s actual speed.
How can I verify a manually calculated metric matches what the router actually computed?
Compare your result against show ip route for the destination network, or show ip eigrp topology <network> for more detail including the Feasible Distance and Reported Distance separately. If your calculation doesn’t match, checking the actual BW and DLY values with show interfaces is the fastest way to find which input was wrong.
Does a longer path with more hops always produce a higher metric than a shorter one?
Not necessarily. As the second worked example shows, delay accumulates across every hop, but bandwidth only ever reflects the single slowest link regardless of hop count. A longer path made entirely of fast, low-delay links can still produce a lower metric than a shorter path that includes one slow or high-delay segment.
Conclusion
Calculating an EIGRP metric by hand comes down to three steps: find the path’s bottleneck bandwidth, sum the path’s total delay, and combine them with the ×256 multiplier that produces EIGRP’s actual 32-bit metric value. Working through a real example — as this guide does, arriving at exactly 258,816 for a specific route, and 2,686,976 for a longer, higher-delay path — turns the number sitting in a routing table from an opaque figure into something fully traceable back to the actual interface characteristics that produced it, and gives a concrete way to sanity-check a router’s behavior whenever a metric looks unexpected.