In the currency market, the accuracy and timeliness of decisions determine the success of a trader. The EUR/USD pair, known for its high liquidity, attracts investors’ interest every day. By identifying key support and resistance levels, EUR/USD trading participants can anticipate potential market turning points and build a more disciplined trading strategy. As of late July 2026, EUR/USD is trading around 1.138–1.144, consolidating below key resistance after pulling back from a June high near 1.16, with the dollar holding a modest edge as markets digest a fresh round of US tariffs and a cautious European Central Bank.
Disclaimer: This article is for informational purposes only and does not constitute financial advice. Trading forex involves significant risk of loss and is not suitable for all investors. Past performance is not indicative of future results. Consult a professional advisor before trading. The author and publisher are not responsible for any actions taken based on the information provided in this content.
Understanding Support and Resistance Levels
Support and resistance levels are price points where an asset’s price often halts and changes direction. Support refers to a level where demand outweighs supply, which stops the price from declining further. Resistance is the opposite — a level where supply outweighs demand, preventing the price from rising further. Traders use these levels to anticipate potential reversals and to time entries and exits.
These concepts are foundational to technical analysis because they mark psychological barriers where buyers or sellers tend to dominate. In ranging markets, prices bounce between support and resistance; in trending markets, a decisive break through one of these levels often signals continuation or reversal.
Current Support and Resistance Levels for EUR/USD (Updated Late July 2026)
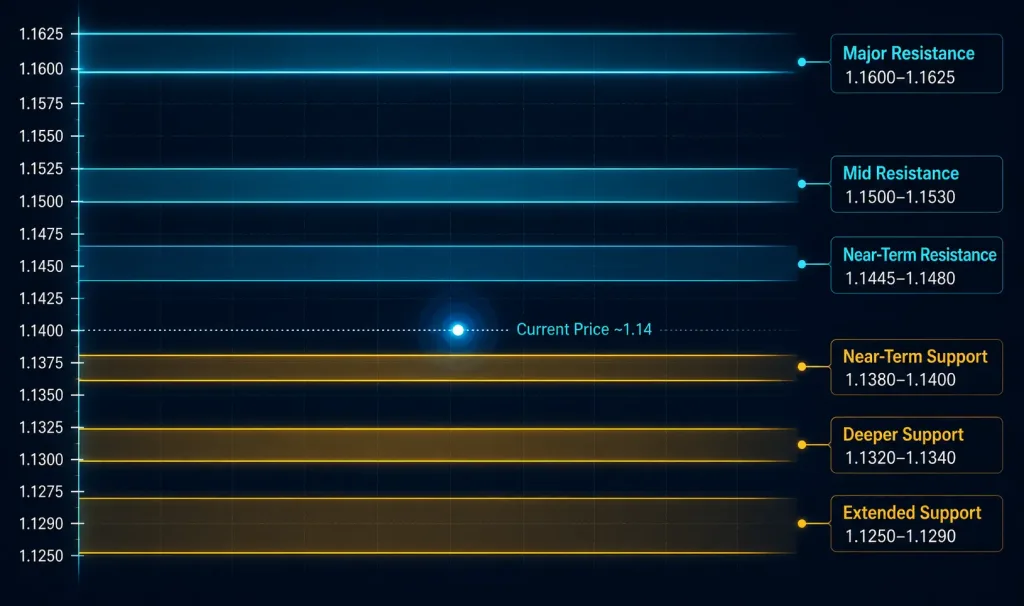
EUR/USD is consolidating in the low 1.14s after a sharp pullback from June’s highs near 1.16 toward a low around 1.1325–1.1340. Key levels currently in focus:
Resistance levels:
- 1.1445–1.1480: Near-term resistance, capping recent rebound attempts.
- 1.1500–1.1530: Mid-term resistance and the 50% Fibonacci retracement zone from the recent decline.
- 1.1600–1.1625: Major resistance aligned with the June swing high; a close above this zone would be needed to shift the broader trend back to bullish.
Support levels:
- 1.1380–1.1400: Near-term support, acting as a magnet for price in recent sessions.
- 1.1320–1.1340: Deeper support, tied to the late-June swing low.
- 1.1250–1.1290: Extended downside target if selling pressure resumes.
The pair has repeatedly tested the 1.1380–1.1400 zone through late July. A daily close below 1.1340 would weaken the short-term structure and open the door toward 1.1250, while a break and close above 1.1480 would be the first concrete sign that buyers are regaining control, with 1.1600 as the next meaningful test.
EUR/USD Market Background: Mid-2026 Review
EUR/USD has had a choppy year in 2026. The pair started the year strong, reaching highs above 1.20 in January, before giving back much of that gain through the spring and summer as the dollar found renewed support. June brought the steepest monthly decline of the year, pulling the pair from the 1.16 area down toward 1.1325, and July has largely been a consolidation phase rather than a clean continuation of either trend.
Two fundamental developments have shaped recent price action. First, the European Central Bank left its key interest rates unchanged at its July 22–23 meeting, in line with expectations, while maintaining a cautious, data-dependent tone and signaling that a further move later in the year remains possible depending on inflation and energy-price developments. Second, the United States, under Donald Trump’s administration, imposed new tariffs on imports from roughly 60 trading partners, including the European Union, which the European Commission described as broadly consistent with the existing EU-US trade arrangement — but which has still added a layer of uncertainty for euro-area exporters.
Energy prices are an additional factor to watch: oil has pushed higher amid tension tied to the US-Iran conflict, which tends to reinforce eurozone inflation concerns and keeps the door open for the ECB to resume policy tightening later in the year if price pressures don’t ease.
Key scenarios: Bullish above 1.1480–1.1500, with potential to retest 1.1600–1.1625; bearish below 1.1340, with 1.1250 as the next meaningful downside target should dollar strength persist.
Technical Indicators (Late July 2026)
RSI (Relative Strength Index): Trading below the 50 midpoint on the daily chart, reflecting continued seller dominance rather than outright oversold conditions — there’s room for further downside before RSI would flag the pair as oversold.
MACD (Moving Average Convergence Divergence): Showing a negative slope, consistent with weakening upward momentum and a market that still favors sellers on a medium-term basis.
Moving Averages: The 21-day moving average has acted as dynamic resistance since mid-May, capping upward attempts and reinforcing the case that sellers remain in control unless price can close and hold above it.
Overall trend read: Medium-term bearish-to-neutral, with the pair in a corrective, range-bound phase rather than a clean directional trend. A daily close outside the 1.1340–1.1480 range would be the clearest technical signal for the next directional move.
Fundamental Drivers Influencing EUR/USD
Beyond the charts, several fundamentals are actively shaping EUR/USD:
- Central bank divergence: The ECB’s decision to hold rates steady in July, paired with hints of further tightening later in the year if inflation stays sticky, contrasts with a Federal Reserve that markets see as more likely to ease. This dynamic can support the euro over time, but the effect has so far been muted by broader dollar demand.
- Trade policy: The new US tariffs on a wide group of trading partners, including the EU, add a layer of uncertainty for European exporters and could weigh on eurozone growth expectations if the measures escalate.
- Energy and inflation: Rising oil prices tied to Middle East tensions keep upward pressure on eurozone inflation, a factor the ECB will be watching closely ahead of its next policy update.
- Eurozone sentiment data: Investor confidence gauges for the eurozone have shown a third consecutive monthly improvement in July, with forward-looking expectations turning positive for the first time in several months — a tentative sign of stabilizing sentiment, even though it hasn’t yet translated into a clear move in bond yields or a sustained euro rally.
Trading Strategies Based on Support and Resistance Levels
Using support and resistance levels in EUR/USD trading allows traders to build more structured strategies:
Rebound trading: Taking a position when price nears a support or resistance level, anticipating a reversal — for example, watching for a bounce near 1.1380–1.1400 with an eye toward a move back to 1.1480.
Breakout trading: Opening a position after a confirmed break of a key level, on the assumption that the move will continue in that direction — for example, watching for volume confirmation on a daily close above 1.1480 or below 1.1340.
Stop-loss and take-profit placement: Placing stop-loss orders just beyond a support or resistance level to limit losses, and take-profit orders at the next meaningful level to lock in gains. Trailing stops can help capture more of a move once a trend is confirmed.
More advanced approaches include combining spot positions with options for hedging, or scalping intraday moves around the 1.1380–1.1480 range while it holds.
Risk Management Tips for EUR/USD Traders
- Position sizing: Risk no more than 1–2% of account capital per trade.
- Diversification: Avoid concentrating risk in a single currency pair.
- Economic calendar awareness: Monitor high-impact events such as US Non-Farm Payrolls, ECB rate decisions, and Fed communications, all of which can move EUR/USD sharply within minutes.
Recommendations for Traders
Monitor economic news: Central bank decisions and major economic releases can significantly move EUR/USD. Keep an eye on upcoming Fed communications and eurozone inflation data, both of which are likely to be key catalysts through the rest of the year.
Combine technical and fundamental analysis: Blending chart-based levels with an understanding of central bank policy and trade developments tends to produce more reliable read on the pair than either approach alone.
Practice on a demo account: Test any new strategy on a demo account before committing real capital, particularly during periods of elevated volatility like the current one.
Maintaining discipline, keeping a trading journal, and adjusting position size to match current volatility are all standard practices worth reinforcing regardless of market conditions.
Conclusion: EUR/USD Outlook for the Rest of 2026
Heading into the back half of 2026, EUR/USD is in a consolidation phase, trading in the low 1.14s after retreating from June’s highs near 1.16. Resistance in the 1.1480–1.1500 zone, and more significantly at 1.1600–1.1625, will need to give way for the bullish case to reassert itself, while a close below 1.1340 would open the door to a deeper pullback toward 1.1250. With the ECB on hold but watchful on inflation, fresh US tariffs adding uncertainty, and energy prices elevated, the setup calls for a cautious, level-by-level approach rather than a strong directional bet in either direction.
Technical analysis of EUR/USD, especially around key support and resistance zones, gives traders useful benchmarks for decision-making — but it works best alongside sound risk management and an awareness of the fundamental backdrop driving the pair.
FAQs
What are the key resistance levels for EUR/USD right now?
The primary resistance zones are 1.1445–1.1480, which has capped recent rebound attempts, followed by 1.1500–1.1530 near the 50% Fibonacci retracement of the recent decline. A sustained break above 1.1600–1.1625 — the June swing high — would be needed to shift the broader trend back toward bullish.
What do the technical indicators suggest about EUR/USD momentum?
The daily RSI is sitting below the 50 midpoint, which points to continued seller dominance rather than outright oversold conditions. MACD is showing a negative slope, consistent with weakening upward momentum, and price remains capped by the 21-day moving average, which has acted as resistance since mid-May. Together, these point to a medium-term bearish-to-neutral bias rather than a strong trend in either direction.
What are the critical support levels to watch for in EUR/USD?
Key supports sit at 1.1380–1.1400, the zone price has repeatedly tested through late July, followed by 1.1320–1.1340 near the late-June swing low. A daily close below 1.1340 would weaken the short-term structure and open the door toward 1.1250–1.1290 as the next downside target.
Is the overall outlook for EUR/USD bullish or bearish?
The near-term picture is mixed and range-bound: the pair needs a confirmed close above 1.1480–1.1500 to support a bullish case toward 1.1600, while a close below 1.1340 would favor sellers targeting 1.1250. Broader risks — including further US tariff escalation, Fed and ECB policy signals, and energy-driven inflation pressure — could push the pair firmly in either direction from here.
What trading strategies are recommended for EUR/USD based on this analysis?
Rebound trading off the 1.1380–1.1400 support zone, breakout trading on a confirmed move beyond 1.1340 or 1.1480, and disciplined stop-loss/take-profit placement around these levels are all reasonable approaches given the current range-bound structure. Combining these technical levels with the fundamental backdrop — ECB policy, US trade measures, and energy prices — and practicing on a demo account first are all worth building into any strategy.
Note: Support/resistance levels and indicator readings reflect market conditions as of late July 2026 and will shift as new price action and economic data emerge. Always verify current levels before trading.