
Network outages happen at the worst possible time — usually 2 AM, usually when you’re on call, and usually when the stakes are highest. The difference between an engineer who panics and one who stays calm comes down to one thing: knowing exactly which commands to run, in which order, and what the output means.
This guide covers every essential network troubleshooting command across Windows, Linux, and Cisco IOS — not just the commands themselves, but real output examples, what to look for, and the workflow that turns raw CLI output into a solved problem.
The OSI Troubleshooting Mindset: Always Go Bottom-Up
Before touching a single command, adopt this mental model: start at Layer 1 and work your way up. Most network outages trace back to Layer 1 or Layer 2 problems — a port that went down, a VLAN mismatch, a spanning-tree topology change. Engineers who jump straight to checking routing tables waste precious time when the real problem is a loose SFP.
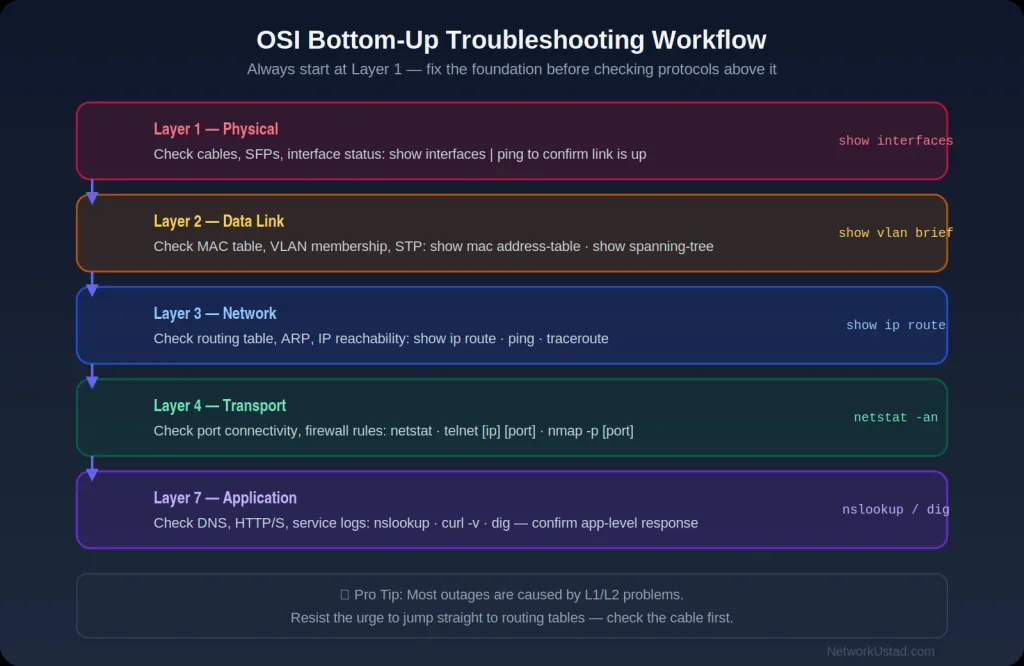
The workflow is simple:
- Layer 1 (Physical): Is the interface up? Is the cable good?
- Layer 2 (Data Link): Is the VLAN correct? Is STP blocking?
- Layer 3 (Network): Is there a route? Does ARP resolve?
- Layer 4 (Transport): Is the port open? Is a firewall blocking?
- Layer 7 (Application): Does DNS resolve? Is the service responding?
The moment you follow this order consistently, troubleshooting becomes methodical instead of guesswork.
Section 1: Universal Commands (Windows, Linux, macOS)
These commands work on virtually every operating system. Master these first — they solve the majority of real-world issues.
ping — Your First Check, Every Time
ping sends ICMP Echo Requests to a target and measures whether it responds and how long it takes. It is the fastest way to confirm Layer 3 connectivity.
Windows:
ping 8.8.8.8
ping -t 8.8.8.8          # continuous ping until Ctrl+C
ping -n 20 8.8.8.8       # send exactly 20 packets
Linux/macOS:
ping -c 4 8.8.8.8         # send 4 packets and stop
ping -i 0.5 8.8.8.8       # faster interval (500ms)
ping -s 1400 8.8.8.8      # test with large packets (MTU check)
What to look for in the output:
Reply from 8.8.8.8: bytes=32 time=14ms TTL=116    ← Healthy
Request timed out.                                  ← No response (firewall or unreachable)
Destination host unreachable.                       ← No route on local network
Pro tips:
- Ping the gateway first before pinging the internet. If the gateway responds but the internet doesn’t, the problem is upstream — not on your device.
- High latency to a nearby host suggests congestion or a routing loop.
- Packet loss in the middle of a ping stream usually points to an unstable link, not a firewall.
traceroute / tracert — Find Exactly Where Traffic Stops
Where ping tells you if traffic reaches the destination, traceroute tells you where it stops. It works by sending packets with increasing TTL values, forcing each router to reveal itself.
Windows:
tracert 8.8.8.8
tracert -d 8.8.8.8        # skip DNS resolution (faster)
Linux/macOS:
traceroute 8.8.8.8
traceroute -n 8.8.8.8     # no DNS lookup
mtr 8.8.8.8               # real-time traceroute with packet loss stats (install separately)
Reading the output:
 1    1 ms    1 ms    1 ms  192.168.1.1       ← Your gateway (local)
 2   12 ms   13 ms   12 ms  10.0.0.1          ← ISP first hop
 3    *       *       *     Request timed out  ← Firewall blocking ICMP (not necessarily broken)
 4   18 ms   17 ms   18 ms  72.14.194.1       ← Google network
 5   15 ms   15 ms   14 ms  8.8.8.8           ← Destination reached
Important: * * * (asterisks) at a hop does not always mean a problem. Many routers deprioritize ICMP traffic and won’t respond to traceroute probes. What matters is whether the next hop responds — if traffic gets through despite asterisks, the path is fine.
A traceroute that stops at hop 3 and never continues means traffic is being dropped at that point. That is where you focus your investigation.
nslookup / dig — DNS Troubleshooting
DNS failures are one of the most common causes of “the internet is broken” complaints. These commands let you test DNS resolution directly.
Windows:
nslookup google.com               # basic lookup using default DNS
nslookup google.com 1.1.1.1       # force query to Cloudflare's DNS
Linux/macOS:
dig google.com                    # detailed DNS query output
dig google.com @8.8.8.8           # use Google's DNS server
dig +short google.com             # return only the IP
dig MX networkustad.com           # check mail records
What to look for:
If ping google.com fails but ping 8.8.8.8 succeeds, DNS is the problem — traffic works but names aren’t resolving. Fix the DNS server setting on the device.
If both fail, the problem is deeper (routing or connectivity, not DNS).
ipconfig / ip addr — See Your Network Configuration
Windows:
ipconfig                    # basic view — IP, subnet, gateway
ipconfig /all               # full detail — MAC, DHCP server, DNS servers, lease times
ipconfig /release           # release DHCP lease
ipconfig /renew             # request new DHCP lease
ipconfig /flushdns          # clear local DNS cache
Linux:
ip addr show                # current IP addresses on all interfaces
ip link show                # interface status (UP/DOWN)
ip route show               # routing table
Useful diagnostic sequence when a host “can’t connect”:
ipconfig /all— Does it have an IP? If it shows 169.254.x.x, DHCP failed.ipconfig /releasethenipconfig /renew— Force a fresh DHCP lease.- If DHCP renew fails, the problem is between the host and the DHCP server.
arp — Find Out Who’s on the Local Network
ARP (Address Resolution Protocol) maps IP addresses to MAC addresses on the local segment. Checking the ARP table tells you whether a device has been seen on the network and confirms Layer 2 connectivity.
Windows / Linux:
arp -a           # Windows: show all ARP entries
arp -n           # Linux: show entries without DNS resolution
ip neigh show    # Linux modern equivalent
Output:
192.168.1.1     00-1a-2b-3c-4d-5e   dynamic    ← Gateway is reachable
192.168.1.50    ff-ff-ff-ff-ff-ff   static     ← Incomplete — device not responding
An Incomplete or missing ARP entry for a host you should be able to reach means Layer 2 connectivity is broken between you and that device — check VLANs, switch ports, and access lists.
netstat — Open Connections and Listening Ports
netstat shows what network connections are currently active and which ports are open on a device.
Windows:
netstat -ano                  # all connections with Process ID
netstat -an | findstr :443    # filter for HTTPS connections
netstat -e                    # ethernet statistics (bytes sent/received, errors)
Linux:
ss -tulnp                     # modern replacement (faster than netstat)
netstat -tulnp                # traditional — TCP/UDP listening ports with process names
netstat -s                    # protocol-level statistics
Practical use: If a web service “isn’t running,” check if it’s actually listening:
ss -tulnp | grep :80
netstat -ano | findstr :80    # Windows
If the port isn’t listed, the service isn’t running. If it is listed but external connections fail, a firewall is blocking it.
Section 2: Windows-Specific Commands
pathping — Ping + Traceroute Combined
pathping (Windows only) sends 100 packets to each hop and reports both latency and packet loss per router. It takes longer than tracert but gives far more useful data when investigating intermittent issues.
pathping 8.8.8.8
Any hop showing consistent packet loss warrants investigation. Loss at only one hop that doesn’t propagate further usually means that router is simply deprioritizing ICMP — not a real problem.
PowerShell Networking Commands (Windows 10/11, Server 2016+)
Modern Windows environments increasingly use PowerShell for network diagnostics:
Test-NetConnection google.com                    # ping equivalent with more detail
Test-NetConnection google.com -Port 443          # test specific TCP port
Get-NetAdapter                                   # list all network adapters
Get-NetIPConfiguration                           # full IP config for all adapters
Resolve-DnsName networkustad.com                 # DNS lookup
Get-NetRoute                                     # routing table
Test-NetConnection is particularly useful because it tests both ICMP reachability and TCP port connectivity in a single command, making it faster than running ping and telnet separately.
Section 3: Linux Commands for Network Engineers
ss — The Modern netstat
ss is faster and more feature-rich than the older netstat. Use it on any modern Linux system:
ss -tulnp          # TCP+UDP listening ports with process names
ss -s              # socket summary statistics
ss -o state established  # all established connections
tcpdump — Packet-Level Visibility
When you need to see exactly what traffic is on the wire, tcpdump is indispensable. This is the Linux equivalent of Wireshark’s capture mode.
tcpdump -i eth0                           # capture all traffic on eth0
tcpdump -i eth0 host 192.168.1.1          # filter by IP
tcpdump -i eth0 port 80 or port 443       # filter by port
tcpdump -w capture.pcap                   # write to file for Wireshark analysis
tcpdump -i eth0 -n -v                     # verbose, no DNS lookup
Security note: tcpdump requires root access. On a production network, always get proper authorization before capturing traffic — even to diagnose issues.
ip — The Swiss Army Knife
The ip command suite handles virtually all network configuration and diagnostics on modern Linux:
ip addr show eth0             # IP addresses on interface
ip link set eth0 up           # bring interface up
ip link set eth0 down         # bring interface down
ip route get 8.8.8.8          # which route would be used to reach this IP
ip neigh show                 # ARP table
Section 4: Cisco IOS Commands
show interfaces — Interface Health at a Glance
The first Cisco command in any troubleshooting session:
Router# show interfaces GigabitEthernet0/0
GigabitEthernet0/0 is up, line protocol is up ← Both must say "up"
  Hardware is CN Gigabit Ethernet, address is 0050.56ff.1234
  Internet address is 192.168.1.1/24
  MTU 1500 bytes, BW 1000000 Kbit/sec
  5 minute input rate 2000 bits/sec, 1 packets/sec
  5 minute output rate 1000 bits/sec, 0 packets/sec
     0 input errors, 0 CRC, 0 frame, 0 overruns ← Errors = hardware/cabling problem
The critical line: GigabitEthernet0/0 is up, line protocol is up
- Admin down / line protocol is down — port was manually shut down:
no shutdownto fix - Up / line protocol is down — physical connection exists but something is wrong at Layer 2 (speed/duplex mismatch, encapsulation mismatch, or the far end is down)
- Up / up — interface is healthy at Layer 1 and Layer 2
show ip interface brief — Quick Status of All Interfaces
Router# show ip interface brief
Interface           IP-Address      OK? Method Status   Protocol
GigabitEthernet0/0  192.168.1.1    YES NVRAM  up        up
GigabitEthernet0/1  10.0.0.1       YES NVRAM  up        up
GigabitEthernet0/2  unassigned     YES unset  admin down down
This gives you a one-page snapshot of every interface on the device — status and IP in seconds.
show ip route — The Routing Table
Router# show ip route
Codes: C - connected, S - static, R - RIP, O - OSPF, B - BGP

O     10.0.1.0/24 [110/2] via 10.0.0.2, 00:12:33, Gi0/1
C     192.168.1.0/24 is directly connected, Gi0/0
S*    0.0.0.0/0 [1/0] via 203.0.113.1                        ← Default route
If a destination is missing from the routing table, traffic to it will fail. Use show ip route [specific-ip] to check whether a particular address is reachable and via which path.
show ip ospf neighbor — OSPF Adjacency Check
When OSPF routes disappear:
Router# show ip ospf neighbor
Neighbor ID    Pri  State     Dead Time  Address      Interface
10.0.0.2       1    FULL/DR   00:00:32   10.0.0.2     Gi0/1  ← Healthy
10.0.0.3       1    EXSTART   00:00:10   10.0.0.6     Gi0/2  ← Problem
OSPF states to know:
- FULL — healthy adjacency, LSAs are synchronized
- EXSTART/EXCHANGE — stuck here usually means MTU mismatch between both ends
- INIT — hello packets are being sent but not received back (check ACLs, multicast reachability, area mismatch)
- 2WAY — normal for non-DR/BDR routers on broadcast segments
show vlan brief — VLAN Configuration
Switch# show vlan brief
VLAN Name       Status    Ports
1    default     active    Gi0/1, Gi0/2
10   MGMT        active    Gi0/3, Gi0/4
20   USERS       active    Gi0/5, Gi0/6
1002 fddi-default act/unsup
Use this to confirm which ports belong to which VLAN. A port in the wrong VLAN is one of the most common causes of “user can’t reach the network” complaints.
show mac address-table — Who Is Where
Switch# show mac address-table
Vlan   Mac Address       Type     Ports
10     0050.56ff.1234    DYNAMIC  Gi0/3    ← Device seen on Gi0/3 in VLAN 10
20     0050.56ff.5678    DYNAMIC  Gi0/5
If a MAC address is listed on an unexpected port, a device may be connected in the wrong location — or someone plugged in an unauthorized switch.
Section 5: The 7-Step Troubleshooting Workflow
Knowing individual commands is useful. Knowing which order to run them under pressure is what separates a skilled engineer from someone who’s just “trying things.”
Step 1 — Define the problem precisely. “The internet is down” is not a problem definition. “Host 192.168.10.50 cannot reach 8.8.8.8 or any external IP, but can reach other hosts on the local subnet” is.
Step 2 — Check Layer 1 (Physical). show interfaces on Cisco. ip link show on Linux. ipconfig on Windows. Confirm the interface is up. If it’s down, nothing above it will work.
Step 3 — Check Layer 2 (Data Link). show vlan brief and show mac address-table on Cisco. Is the host in the right VLAN? Is its MAC learned on the right port?
Step 4 — Check Layer 3 (Network). ping [gateway] — can the host reach its default gateway? If not, the problem is on the local segment. If yes, ping 8.8.8.8 — can it reach the internet by IP? show ip route — is there a route?
Step 5 — Trace the path. traceroute / tracert to the destination. Find the hop where traffic stops.
Step 6 — Check application-layer services. nslookup / dig for DNS. telnet [ip] [port] or Test-NetConnection [ip] -Port [port] to confirm the specific service port is open.
Step 7 — Document and fix. Once you understand the root cause, implement the fix. Then confirm the fix worked by re-running the same tests you ran in steps 2–6.
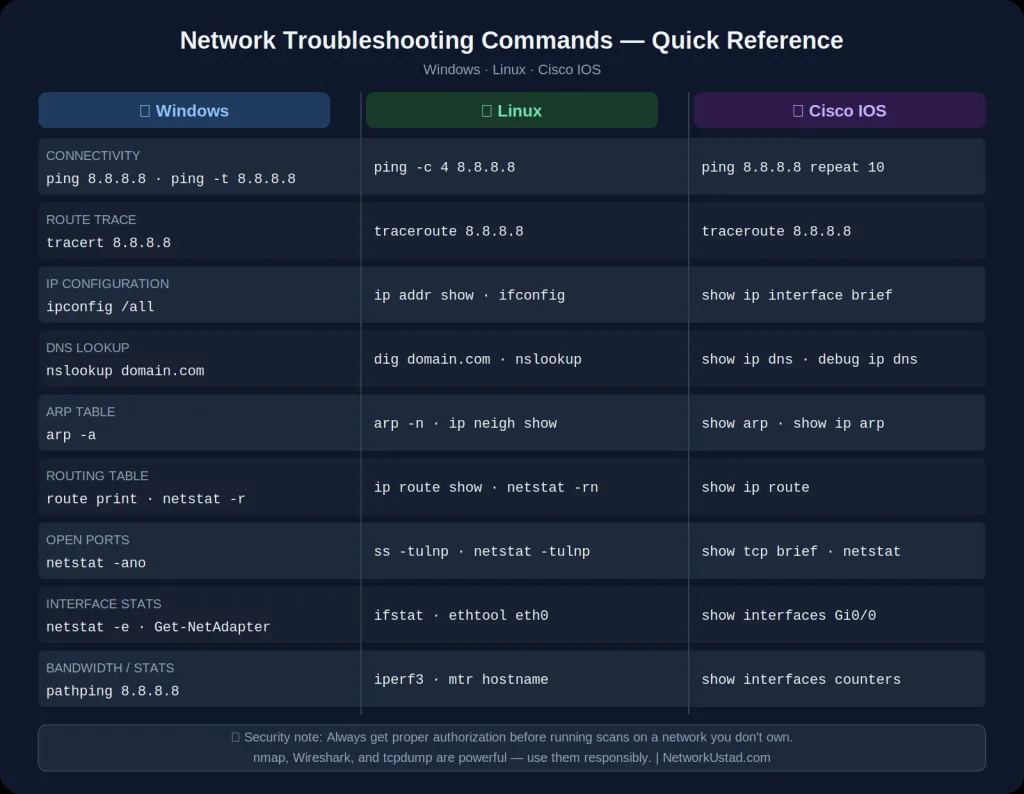
Quick Reference: Commands by Problem Type
| Problem | First command to run |
|---|---|
| “Can’t reach the internet” | ping 8.8.8.8 — if this works, it’s DNS (nslookup) |
| “Can’t reach a specific site” | ping [domain] then nslookup [domain] |
| “Slow network” | ping -t to check latency, pathping for hop-by-hop loss |
| “IP address is wrong” | ipconfig /all → ipconfig /renew if DHCP |
| “Can’t reach hosts on same network” | arp -a — check if gateway ARP resolves |
| “OSPF routes missing on Cisco” | show ip ospf neighbor → check for EXSTART/INIT |
| “Port appears unreachable” | ss -tulnp (Linux) / netstat -ano (Windows) |
| “VLAN not working” | show vlan brief → show interfaces switchport |
| “Interface keeps going down” | show interfaces → check for CRC errors / input errors |
Conclusion
Network troubleshooting is a skill built through repetition. The first time you use show ip ospf neighbor under pressure will feel uncomfortable. The twentieth time, you’ll know exactly where to look before the output finishes printing.
Start with the OSI model. Trust the process. Document your findings. And remember: most network problems are simpler than they first appear — the complexity is usually in finding exactly where to look, not in the fix itself.
Article written and reviewed by Asad Ijaz Khattak, Lead Networking Architect at NetworkUstad — CCNP and CCNA certified, with 10+ years of enterprise network design and troubleshooting experience.