Domain 4.5 | IP Services — 10% of exam
Learning Objectives
By the end of this lesson, you will be able to:
- Explain why centralized logging matters, beyond what a device’s local log storage can provide.
- Describe the structure of a syslog message, including facility, severity, and timestamp.
- Correctly order syslog severity levels from most to least urgent, without relying on intuition alone.
- Explain the purpose of syslog facilities in categorizing message sources.
- Recognize the common logging destinations (console, buffer, syslog server) and the trade-offs between them.
Key Terms Glossary
| Term | Definition |
|---|---|
| Syslog | The standard protocol and message format for system logging, allowing devices to send log messages to a centralized server. |
| Syslog server | A centralized system that collects and stores log messages from multiple network devices. |
| Facility | A categorization of a syslog message’s general source or type, such as kernel messages or authentication-related messages. |
| Severity level | A numeric value (0–7) indicating how urgent or serious a syslog message is, with lower numbers indicating higher severity. |
| Local buffer | A limited amount of memory on a device used to store recent log messages when no centralized logging is configured or reachable. |
| Console logging | Sending log messages directly to a device’s console session in real time. |
| Buffered logging | Storing log messages in a device’s local memory buffer, retrievable with a show command. |
| Trap logging | Sending log messages to a remote syslog server, using the term “trap” in a logging-specific sense distinct from SNMP traps. |
Why Centralized Logging Matters
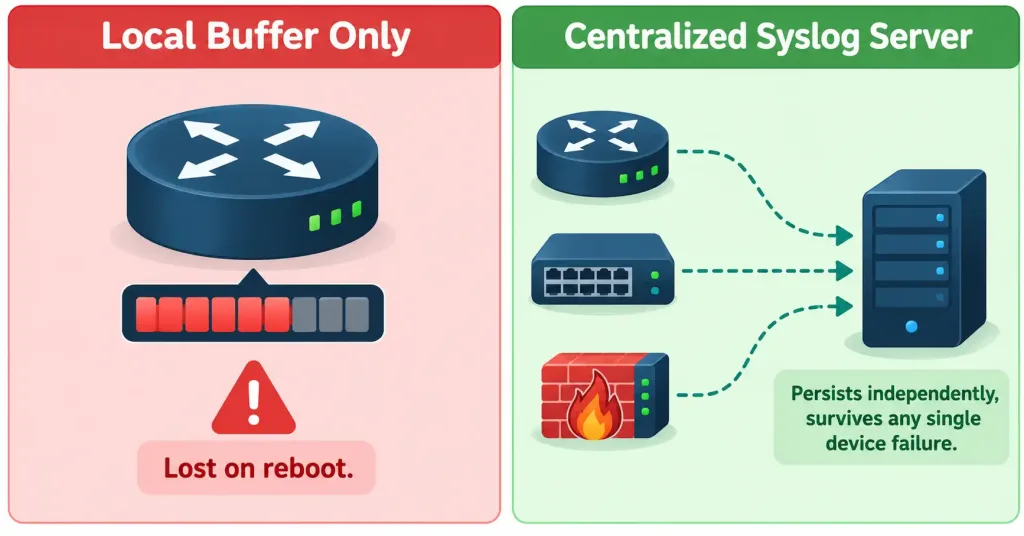
Every network device generates log messages constantly — interface state changes, configuration changes, authentication attempts, error conditions, and routine operational events. By default, most of these messages are stored only in a small local memory buffer, which is both limited in size and, critically, volatile — a device reboot or crash can wipe out exactly the log history you’d most want to review afterward to understand what went wrong.
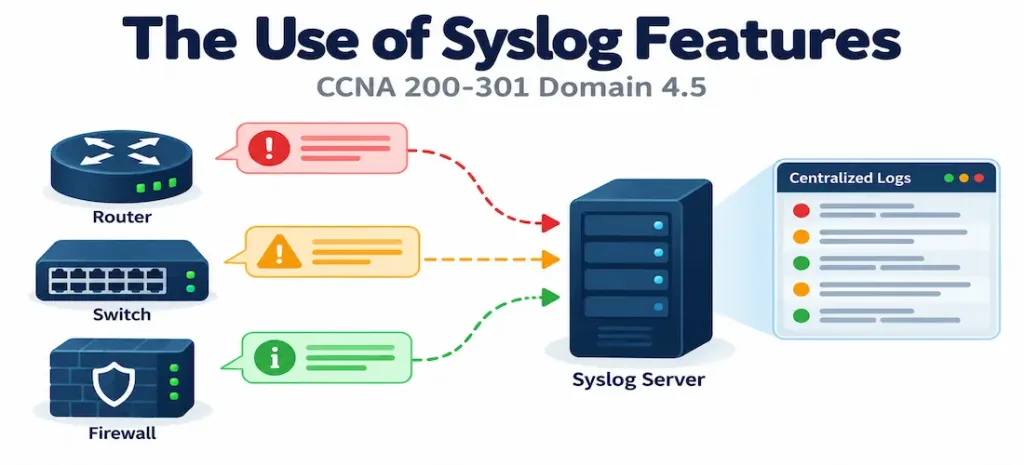
Syslog solves this by defining a standard protocol and message format that lets devices send their log messages to a centralized syslog server, where messages persist independently of any single device’s uptime, storage limits, or reboot cycles. This matters for two closely related reasons. First, capacity: a dedicated syslog server can retain months or years of history, far beyond what any individual device’s local buffer could hold.
Second, and just as important: correlation. Reconstructing what happened during a multi-device incident requires comparing log entries from several different devices side by side, in a shared timeline — something that’s far more practical when all those logs already live in one centralized location, rather than requiring an administrator to individually connect to and export logs from every device involved after the fact.
That correlation benefit depends entirely on something covered in objective 4.2: accurate, synchronized time. A centralized repository of logs from multiple devices is only genuinely useful for reconstructing a sequence of events if every device’s timestamps can be trusted relative to each other — a syslog server full of messages from devices with independently drifting clocks can actually make correlation harder, not easier, since the timestamps themselves become misleading. NTP and syslog are frequently deployed together for exactly this reason; one provides the trustworthy clock, the other provides the centralized record that clock makes meaningful.
Anatomy of a Syslog Message
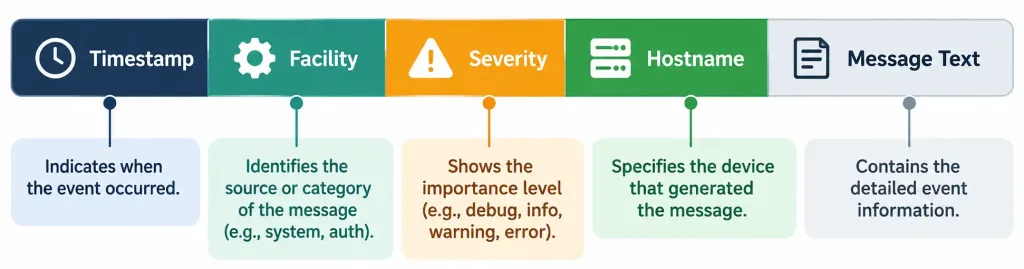
A syslog message isn’t just free-form text — it carries structured metadata alongside the message itself, and understanding that structure is most of what this objective actually tests. A typical syslog message includes:
- A timestamp, indicating when the event occurred
- The facility, categorizing the general source or type of the message
- The severity level, indicating how urgent the message is
- The hostname or device identifier, indicating which device generated the message
- The message text itself, describing what actually happened
Facilities: Categorizing the Source
A facility identifies the general category a message belongs to — kernel-level messages, authentication-related messages, and so on. Standard facilities include things like kern (kernel messages), auth (authentication and authorization messages), and local0 through local7, a set of facilities deliberately left generic and undefined by the standard specifically so that individual organizations or device vendors can use them for their own custom categorization needs. Facilities allow a syslog server (or the administrator reviewing its output) to filter and route messages meaningfully — sending all authentication-related messages to a security team’s dashboard, for instance, while routing routine interface-state messages elsewhere, rather than treating every log message as an undifferentiated stream.
Reading a Real Cisco IOS Log Message
The concepts above become much more concrete when applied to an actual message IOS generates. A typical console message looks like this:
%LINK-3-UPDOWN: Interface GigabitEthernet0/1, changed state to downBreaking this down piece by piece: LINK is the Cisco-specific facility, indicating this message relates to a physical or logical link event, distinct from the standard syslog facilities like kern or auth described above — Cisco defines its own set of facility names covering IOS subsystems (LINK, OSPF, SYS, and dozens of others) alongside, not instead of, the traditional syslog facility concept.
The 3 is the severity level — Error, per the table above — reflecting that an interface going down is a meaningful operational event worth flagging, though not catastrophic on its own. UPDOWN is a mnemonic, a short, human-readable tag identifying the specific type of event within that facility, making the message scannable at a glance even before reading the full text. Everything after the colon is the actual message text describing what happened.
This %FACILITY-SEVERITY-MNEMONIC: message structure is worth being able to parse on sight, since it’s exactly the format you’ll encounter in real show logging output and real troubleshooting scenarios, not just an abstract concept confined to a glossary definition.
Standard Facility Numbers
Beyond the named facilities like kern and auth, the syslog standard also defines numeric facility codes, useful to recognize since some tooling and configuration references facilities by number rather than name:
| Number | Facility |
|---|---|
| 0 | kernel messages |
| 1 | user-level messages |
| 3 | daemon (system process) messages |
| 4 | security/authorization messages |
| 16–23 | local0 through local7 (custom use) |
This numbering is largely a reference detail rather than something requiring memorization for CCNA, but recognizing that facilities have both a name and a number — the same way severity levels have both a name and a number — reinforces that syslog’s structure is consistently built around named categories paired with compact numeric codes throughout, not just for severity.
Severity Levels: Lower Number, Higher Urgency
This is the single most frequently tested detail in this entire objective, and it runs backward from what most people initially assume. Syslog severity levels range from 0 to 7, and lower numbers indicate higher severity — the opposite of an intuitive “bigger number means bigger problem” assumption.
| Level | Name |
|---|---|
| 0 | Emergency |
| 1 | Alert |
| 2 | Critical |
| 3 | Error |
| 4 | Warning |
| 5 | Notice |
| 6 | Informational |
| 7 | Debugging |
A level 0 (Emergency) message indicates the system is unusable — about as serious as a message gets. A level 7 (Debugging) message is routine, detailed diagnostic output generated constantly during normal operation, useful for troubleshooting but not indicating a problem at all. Comparing any two levels directly: level 2 (Critical) is more urgent than level 5 (Notice), precisely because 2 is the lower number.
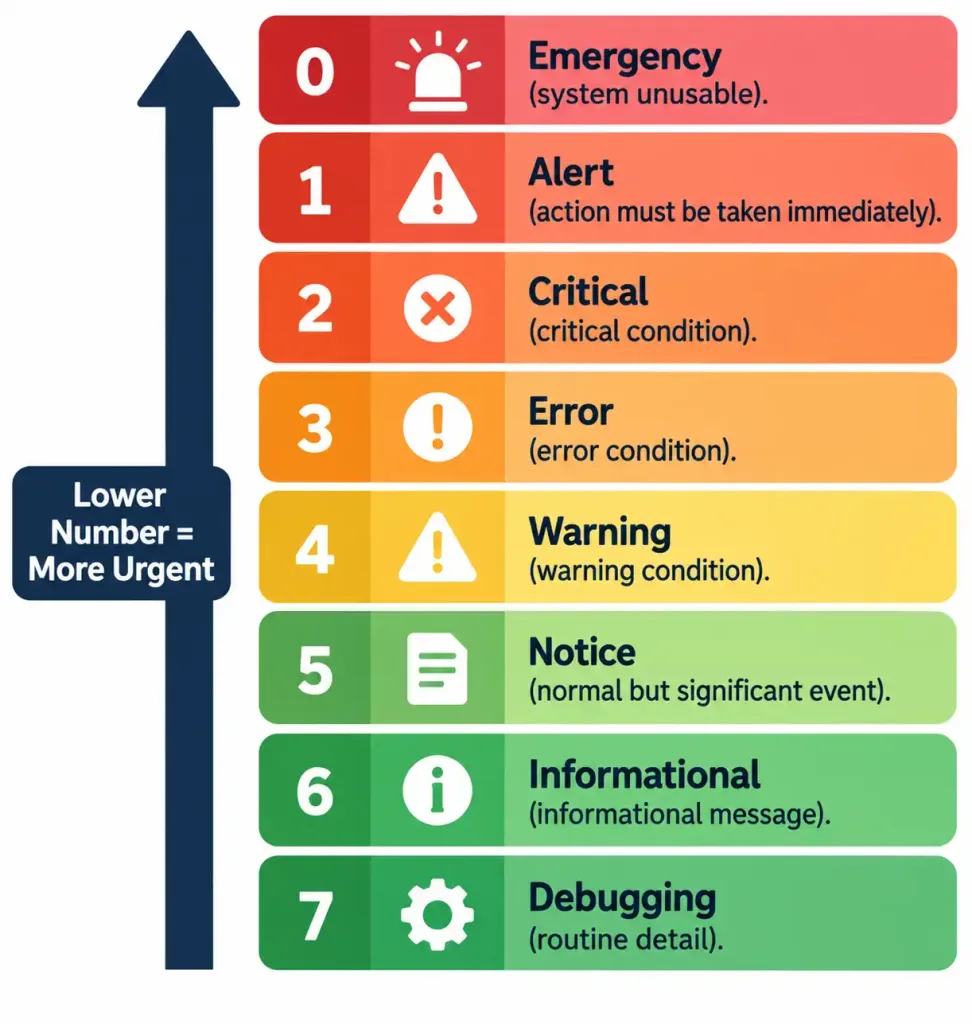
This same “lower number, more significant” pattern shows up elsewhere in networking — OSPF administrative distance and OSPF cost both work the same way, where a lower value indicates a more preferred or more trusted option. Recognizing this as a recurring convention, rather than a series of unrelated facts to separately memorize for each protocol, makes all of them easier to keep straight under exam pressure.
An important practical detail tied to severity: when logging is configured to a particular severity level, that level and everything more severe (numerically lower) is included, not just messages at that exact level. Configuring logging at level 4 (Warning) means levels 0 through 4 all get logged — Emergency, Alert, Critical, Error, and Warning — while levels 5 through 7 (Notice, Informational, Debugging) are excluded. This inclusive-downward behavior is easy to get backward if you’re not paying attention to the direction the severity numbers run.
Logging Destinations
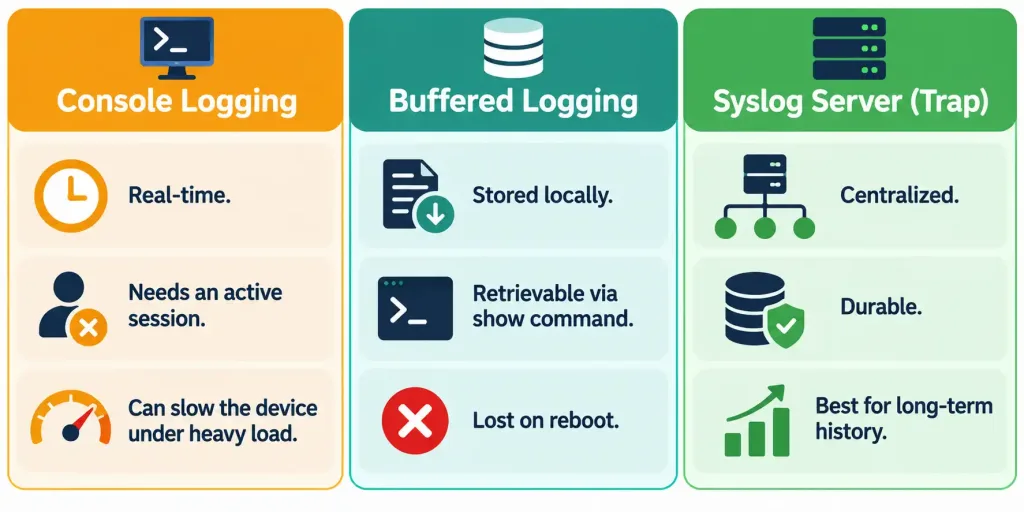
A device can send its log messages to several different destinations simultaneously, each suited to a different purpose:
- Console logging sends messages directly to an active console session in real time — useful for watching events live during hands-on troubleshooting, but useless if nobody happens to be connected to the console at the moment something happens, and it can meaningfully slow down a device if console output is heavy and the console connection itself is slow.
- Buffered logging stores messages in the device’s local memory, retrievable later with a show command — better than console logging for after-the-fact review, but still limited by local memory size and lost on a reboot.
- Syslog server (trap) logging sends messages to a remote, centralized syslog server — the most durable and scalable option, and the one this lesson has emphasized throughout for exactly that reason.
The term “trap” here is worth flagging as a potential point of confusion: in the context of logging trap <level> configuration, “trap” refers to sending log messages to a remote syslog destination, and has no direct relationship to SNMP traps (covered in objective 4.4) despite the shared terminology — they’re two entirely separate mechanisms that happen to reuse the same word.
Common Misconceptions
- “Higher severity numbers mean more severe messages.” The opposite is true — lower numbers (0 being the most severe) indicate higher urgency, the reverse of what many candidates initially assume.
- “Configuring logging at a specific severity level only logs messages at exactly that level.” It logs that level and everything more severe (every numerically lower level) as well — severity filtering is inclusive downward toward more urgent messages, not an exact-match filter.
- “A device’s local log buffer is a reliable long-term record.” It’s limited in size and volatile — a reboot or crash can erase it entirely, which is precisely why centralized syslog logging exists.
- “Syslog ‘trap’ logging is the same mechanism as an SNMP trap.” They share a name by coincidence of terminology, but they’re unrelated mechanisms — syslog trap logging sends log messages to a remote syslog server, while an SNMP trap is a separate protocol-specific alert mechanism entirely.
- “Facilities indicate how severe a message is.” Facilities categorize the source or type of a message (kernel, authentication, and so on); severity is a completely separate dimension indicating urgency.
Configuration and Verification at a Conceptual Level
This objective focuses on describing syslog’s use rather than a full configuration walkthrough, but seeing the basic configuration elements grounds the concepts covered above. A simple configuration sending logs to a centralized server looks like:
logging host 192.168.1.100
logging trap warning
logging buffered 16384
Here, logging host 192.168.1.100 designates the centralized syslog server’s address; logging trap warning sets the severity threshold for messages sent to that server at Warning (level 4) and everything more severe; and logging buffered 16384 sets the local buffer size (in bytes) for messages retained locally in addition to whatever’s sent to the remote server.
Verification uses:
Router# show logging
Syslog logging: enabled
    Console logging: level debugging, 42 messages logged
    Monitor logging: level debugging, 0 messages logged
    Trap logging: level warning, 38 messages logged
    Logging to 192.168.1.100
Buffer logging: level debugging, 16384 bytes max, 42 messages logged
This output confirms which destinations are active, the severity threshold configured for each, and how many messages have actually been logged to each destination — a message count for trap logging that stays at zero despite an active configuration is a strong signal the syslog server itself is unreachable or misconfigured, rather than a logging configuration problem on the device generating the messages.
A Note on Logging Volume
It’s worth being aware that logging everything at a very permissive severity threshold (say, level 7, capturing debugging messages) to the console specifically can create a real operational problem of its own: a device experiencing a genuine issue — a flapping interface, for instance — can generate console messages fast enough to noticeably impact CPU performance or make an active console session nearly unusable at the exact moment an administrator most needs it to be responsive.
This is one practical reason console logging is often kept at a more conservative severity threshold than buffered or remote syslog logging, which don’t carry the same real-time display overhead. Recognizing that a logging configuration choice can itself become an operational concern, not just a passive background feature, is a useful piece of practical judgment beyond the pure definitions covered elsewhere in this lesson.
Troubleshooting Patterns
“Syslog messages aren’t arriving at the centralized server, even though logging is configured.” Confirm basic IP reachability to the syslog server address, and check whether anything (an access list, a firewall) might be blocking UDP port 514, syslog’s standard port. Also confirm the configured severity threshold isn’t set so restrictively (say, Emergency only) that routine messages are being correctly filtered out rather than lost.
“Important messages seem to be missing from the log.” Check the configured severity level for that destination — if the threshold is set too high in urgency (a numerically low level like Critical), less severe but still meaningful messages (Warning, Notice) will be filtered out entirely, which can look like a logging failure when it’s actually working exactly as configured.
“The local buffer only shows a small window of recent history.” This is expected behavior for buffered logging, which is inherently limited by local memory size — this is precisely the scenario centralized syslog logging is meant to address, since a remote server isn’t constrained by any single device’s local memory.
“Log timestamps across different devices don’t line up correctly during incident review.” This points back to unsynchronized clocks rather than a syslog problem itself — confirming NTP is correctly configured and synchronized on all relevant devices (per objective 4.2) is the appropriate fix, not anything within syslog’s own configuration.
Frequently Asked Questions
What transport protocol does syslog typically use? Syslog traditionally uses UDP, typically on port 514, though secure or reliable variants using TCP exist in some implementations for environments where guaranteed delivery matters more than the low overhead UDP provides.
Can a device send logs to more than one syslog server at once? Yes — multiple logging host statements can be configured, sending the same log messages to several centralized destinations simultaneously, useful for redundancy or when different teams need visibility into the same data.
Do all eight severity levels actually get used in practice? Yes, though levels 6 (Informational) and 7 (Debugging) are by far the most common in day-to-day volume, since they cover routine operational messages; levels 0–2 (Emergency, Alert, Critical) are rare by design, reflecting genuinely serious conditions.
Is it possible to configure different severity thresholds for different destinations? Yes — it’s common practice to set a lower urgency threshold (more messages) for local buffered logging, useful for detailed troubleshooting, while setting a higher urgency threshold (fewer messages) for remote syslog server logging to avoid overwhelming the centralized system with routine noise.
Why would local0 through local7 facilities exist if they’re undefined? They’re deliberately left generic specifically so organizations and vendors can assign their own meaning to them for custom categorization needs, rather than syslog’s standard trying to anticipate every possible message source in advance.
Does Cisco’s %FACILITY-SEVERITY-MNEMONIC message format replace the standard syslog facility and severity concepts? No — it sits alongside them. When IOS forwards a message to an actual syslog server, the underlying standard syslog facility and severity fields are still populated according to the protocol’s own format; the %FACILITY-SEVERITY-MNEMONIC text is IOS’s own human-readable convention layered on top for console and buffered display, using Cisco-specific facility names (LINK, OSPF, SYS) rather than the standard syslog facility list. Both systems of categorization exist and serve the same underlying purpose from slightly different angles.
Syslog Logging and Monitoring: Practice Quiz
Test your knowledge of syslog severity levels, facilities, logging destinations, timestamps, and Cisco IOS logging.
Summary
- Syslog provides a standard protocol and format for centralized logging, addressing the size limitations and volatility of a device’s local log buffer.
- A syslog message includes a timestamp, facility (message category), severity level (urgency), hostname, and the message text itself.
- Severity levels run from 0 (Emergency, most severe) to 7 (Debugging, least severe) — lower numbers mean higher urgency, the reverse of common intuition, and configuring a given level includes that level plus everything more severe.
- Facilities categorize a message’s general source (kernel, authentication, or custom local0–local7 categories) and are entirely separate from severity.
- Console, buffered, and syslog server (trap) logging each serve different purposes, with centralized syslog server logging being the most durable and scalable option — and accurate, NTP-synchronized time (objective 4.2) is what makes cross-device log correlation actually meaningful.