Domain 3.0 | Network Operations — 19% of exam
Learning Objectives
By the end of this lesson, you will be able to:
- Explain why network monitoring matters and how it connects to performance baselines
- Describe how SNMP works, including its manager/agent model and version differences
- Explain syslog, its severity levels, and the purpose of log aggregation
- Describe how baseline metrics support anomaly detection
- Recognize common network monitoring gaps and misconfigurations
Key Terms
| Term | Definition |
|---|---|
| SNMP (Simple Network Management Protocol) | A protocol used to monitor and manage network devices, based on a manager polling agents for status information |
| MIB (Management Information Base) | A structured database of manageable objects on a device, each identified by an OID |
| Syslog | A standardized protocol for sending log messages from network devices to a central logging server, categorized by severity level |
| Log Aggregation | The practice of collecting logs from many devices into one centralized, searchable platform |
| Baseline | A recorded measurement of normal network performance, used as a reference point to detect abnormal behavior later |
Explanation
From Change Management to Ongoing Monitoring
The previous lesson introduced configuration baselines — the known-good state a device’s configuration should match. This lesson extends that same baseline concept to network performance: just as a configuration baseline defines what a device’s settings should look like, a performance baseline defines what normal traffic, latency, and error rates look like, so that monitoring tools can actually recognize when something has gone wrong.Why Monitoring Matters: You Can’t Fix What You Can’t See
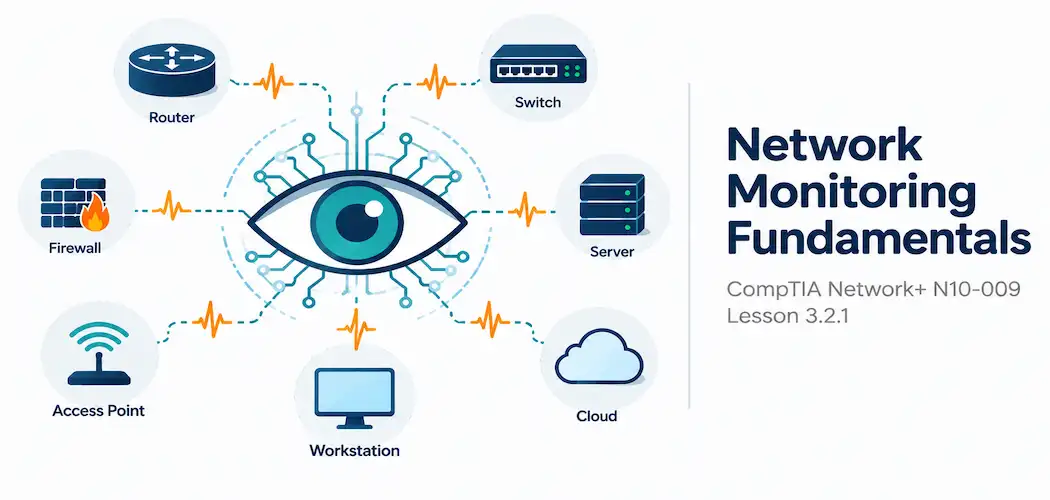
A network with no active monitoring only reveals problems when a user complains, and by that point the problem has often already been affecting people for a while. Proactive monitoring flips that around — collecting continuous data on device health, traffic patterns, and error conditions so that problems get caught (and ideally addressed) before they cause a noticeable outage. This is the foundation the rest of this objective builds on: monitoring tools are only as useful as the data they collect and the baseline they compare it against.
SNMP: Simple Network Management Protocol
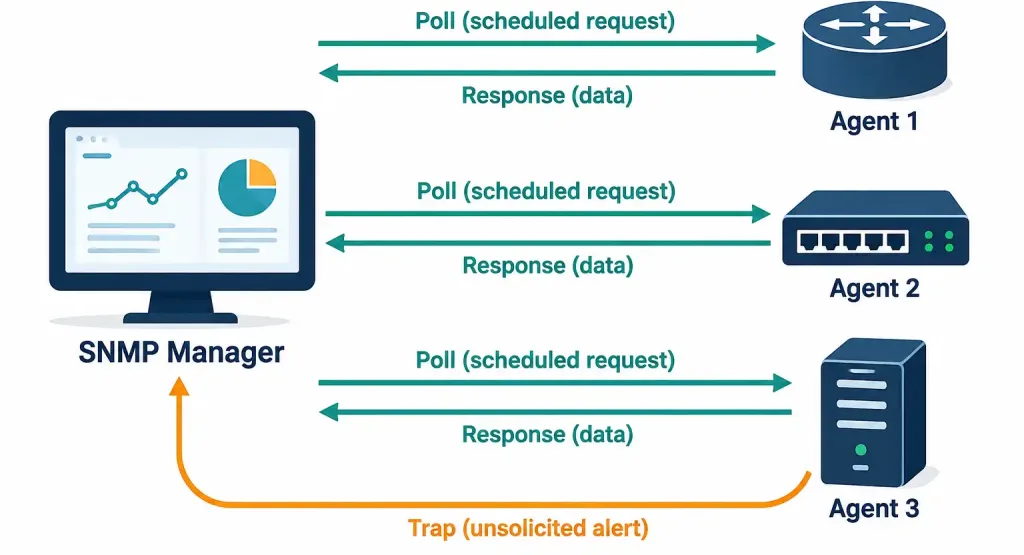
SNMP is the standard protocol for monitoring and managing network devices remotely. It works on a manager/agent model: a central SNMP manager (the monitoring platform) communicates with agents running on individual devices — routers, switches, servers — which expose data about their own status.
That exposed data is organized in a MIB (Management Information Base), a structured hierarchy of manageable objects, each uniquely identified by an OID (Object Identifier). When a manager wants to know a specific value — say, an interface’s current traffic counter — it queries that interface’s specific OID within the device’s MIB.
SNMP communication happens two main ways:
- Polling — the manager periodically asks an agent for specific data, on a schedule the administrator controls.
- Traps — the agent proactively sends an unsolicited message to the manager when a significant event occurs (like an interface going down), rather than waiting to be asked.
SNMP has gone through several versions, and the differences matter for security reasons: SNMPv1 and SNMPv2c authenticate using a simple community string sent in plain text, which is weak by modern standards — anyone able to observe the traffic can potentially read or guess that string. SNMPv3 added real authentication and encryption, making it the appropriate choice for any environment that takes security seriously, and it’s generally the version recommended for new deployments.
Syslog and Log Aggregation
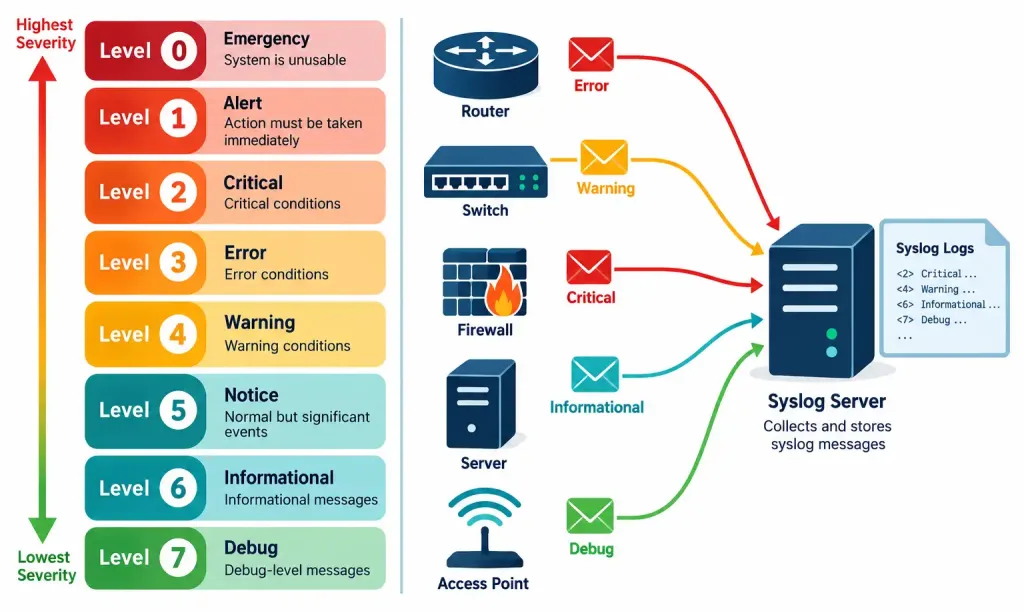
Syslog is a standardized protocol for sending log messages from network devices to a central logging server. Rather than an administrator having to log into every individual device to check its local logs, syslog lets devices push their log messages outward to one central place, where events across the entire network can be viewed together.
Syslog messages are categorized by severity level, ranging from level 0 (Emergency — the system is unusable) through level 7 (Debug — detailed diagnostic information), with levels like Alert, Critical, Error, Warning, Notice, and Informational in between. This severity scale lets an administrator filter for what actually matters — configuring alerts on Critical-and-above messages, for instance, while still retaining lower-severity messages for later troubleshooting without them cluttering active alerts.
Log aggregation takes this a step further, collecting logs not just from network devices via syslog but from a much broader range of sources — servers, applications, security tools — into one centralized, searchable platform. This matters because a real incident often shows up as related log entries scattered across several different systems; without aggregation, correlating those entries into one coherent picture of what actually happened means manually checking each system separately, which is slow and easy to get wrong under pressure.
Baseline Metrics and Anomaly Detection
A baseline is a recorded measurement of what normal looks like: typical bandwidth utilization on a given link, typical latency between two sites, typical error rates on an interface, usually gathered over a meaningful period of time to smooth out normal daily and weekly variation. Without a baseline, a monitoring tool has no real basis for judging whether a given reading is normal or concerning — is 40% bandwidth utilization high or low? The honest answer is: it depends entirely on what that link’s baseline looks like.
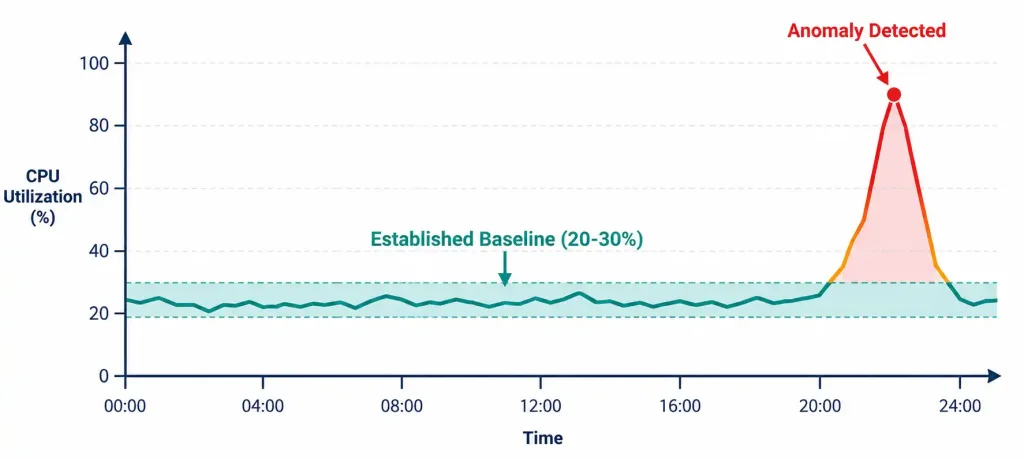
Once a baseline exists, anomaly detection becomes possible: comparing current readings against the established baseline to flag genuinely unusual behavior — a sudden spike in error rates, a link running far above its typical utilization, latency significantly higher than normal. This is a meaningfully more useful approach than relying on fixed, arbitrary thresholds alone, since what counts as “too high” genuinely differs from one link or device to another, and a baseline captures that context automatically.
Recognition-Level Verification Concepts
A few patterns are worth recognizing on sight:
- A monitoring platform periodically requesting a specific OID’s value from a device is SNMP polling; a device proactively sending an alert without being asked is an SNMP trap.
- A community string sent in plain text over the network points to SNMPv1 or SNMPv2c; authenticated, encrypted SNMP traffic points to SNMPv3.
- A log message tagged with a severity level like “Critical” or “Warning,” sent from a device to a central server, is a syslog message.
- A sudden reading well outside a link’s established historical range is exactly what baseline-driven anomaly detection is designed to flag.
Common Exam Traps
- SNMPv1/v2c’s community string is not a real security mechanism by modern standards. It’s transmitted in plain text, unlike SNMPv3’s actual authentication and encryption — don’t treat all SNMP versions as equally secure.
- Polling and traps are two different communication directions, not interchangeable terms. Polling is manager-initiated; traps are agent-initiated.
- Syslog severity levels run from 0 (most severe) to 7 (least severe) — lower numbers mean more severe, not less. This numbering direction trips people up frequently.
- A baseline is not a fixed, one-time threshold. It’s a reference built from real historical data, and what counts as anomalous depends entirely on that specific baseline, not a universal number that applies to every link or device.
- Log aggregation and syslog are related but not identical. Syslog is one protocol commonly used to centralize device logs; log aggregation is the broader practice of consolidating logs from many different kinds of sources, not just network devices.
Lesson 3.2.1 Practice Quiz — Network Monitoring Fundamentals
17 questions covering SNMP polling/traps, SNMP versions, syslog severity levels, log aggregation, and baselines.
N10-009 · Domain 3.2Summary
Network monitoring proactively catches problems using continuous data collection, rather than waiting for users to report issues.
SNMP uses a manager/agent model, with data organized in a MIB and identified by OIDs; SNMPv3 adds real authentication and encryption over the plain-text community strings used in SNMPv1/v2c.
Polling is manager-initiated data collection; traps are agent-initiated alerts sent proactively when a significant event occurs.
Syslog standardizes log messages by severity level (0 Emergency through 7 Debug) and sends them to a central server; log aggregation broadens this to collect logs from many types of sources into one searchable platform.
A baseline records what normal performance looks like over time, making genuine anomaly detection possible — without one, there's no meaningful way to judge whether a given reading is actually abnormal.