Domain 3.0 | Network Operations — 19% of exam
Learning Objectives
By the end of this lesson, you will be able to:
- Explain flow data (NetFlow/sFlow) and what it reveals about network traffic
- Distinguish flow data from full packet capture and identify when each is appropriate
- Explain SPAN/port mirroring and how it enables non-disruptive traffic capture
- Describe network discovery and API integration as modern monitoring and automation tools
- Identify the appropriate monitoring approach for a given troubleshooting or visibility need
Key Terms
| Term | Definition |
|---|---|
| Flow Data (NetFlow/sFlow) | Summarized metadata about network traffic — source/destination, port, protocol, and volume — without capturing full packet content |
| Packet Capture | Recording the complete contents of network packets for detailed analysis |
| SPAN (Switched Port Analyzer) | A switch feature that copies traffic from one or more source ports to a destination port, often called port mirroring |
| Network Discovery | Automated scanning to identify and inventory devices connected to a network |
| API Integration | Using an application programming interface to pull monitoring data or push configuration directly, rather than relying solely on protocols like SNMP |
Explanation
From Fundamentals to Advanced Techniques
The previous lesson covered SNMP, syslog, and baselines — the foundational tools that tell you a device’s status and whether current behavior looks normal. This lesson covers the techniques that go a level deeper: understanding not just that something is happening, but exactly what traffic is flowing and why.Flow Data: NetFlow and sFlow
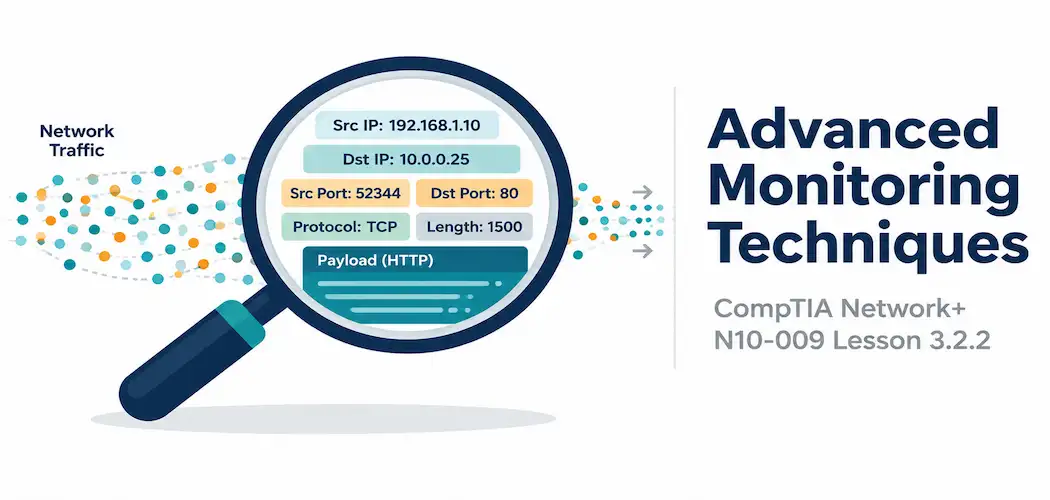
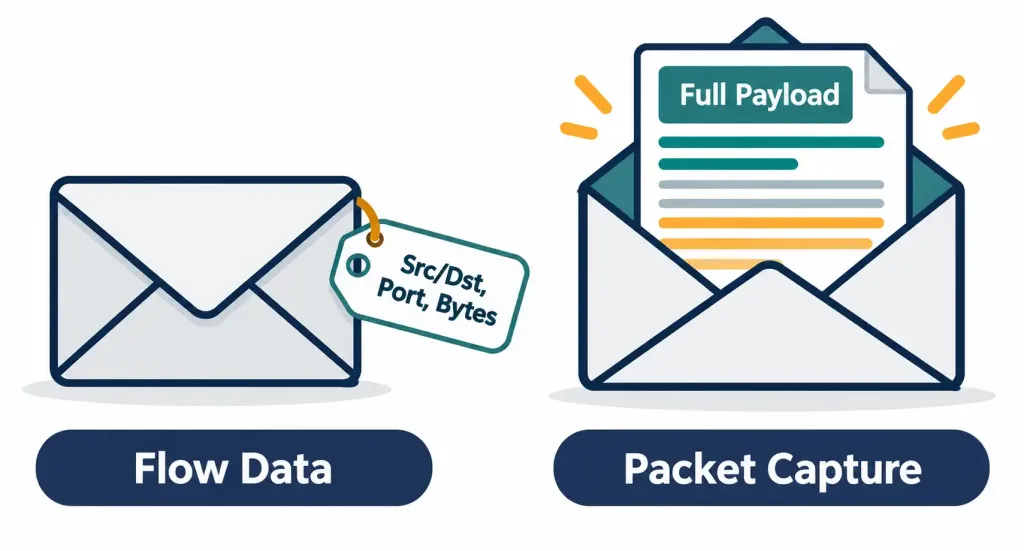
Flow data — collected through protocols like NetFlow (Cisco’s implementation) or sFlow (a vendor-neutral equivalent) — summarizes network traffic without recording the actual packet contents. A flow record typically captures source and destination IP addresses, port numbers, protocol, and volume (bytes and packets transferred), giving a clear picture of who is talking to whom, how much, and using what, without needing to store or inspect the actual data being exchanged.
This makes flow data extremely efficient for big-picture traffic analysis: identifying top talkers consuming the most bandwidth, spotting an unexpected spike in traffic to an unfamiliar destination, or feeding long-term capacity planning — all without the storage and processing overhead that recording every single packet’s full content would require.
Packet Capture: Full Detail When You Need It
Packet capture goes further, recording the actual contents of packets crossing a link — not just metadata about them. This level of detail is essential for deep protocol troubleshooting: diagnosing a malformed handshake, inspecting the actual payload of a suspicious connection, or verifying exactly what data a misbehaving application is sending.
That level of detail comes at a real cost, though. Full packet capture generates enormous volumes of data very quickly and demands meaningfully more storage and processing than flow data. This is exactly why packet capture is typically used surgically — capturing a specific link for a limited window while actively troubleshooting a known issue — rather than running continuously across an entire network the way flow data monitoring often does.
SPAN and Port Mirroring
Actually getting traffic to a capture tool without disrupting the network it’s monitoring requires a specific mechanism: SPAN (Switched Port Analyzer), also commonly called port mirroring. A switch configured for SPAN copies traffic from one or more designated source ports (or an entire VLAN) to a separate destination port, where a packet capture tool or analyzer is connected.
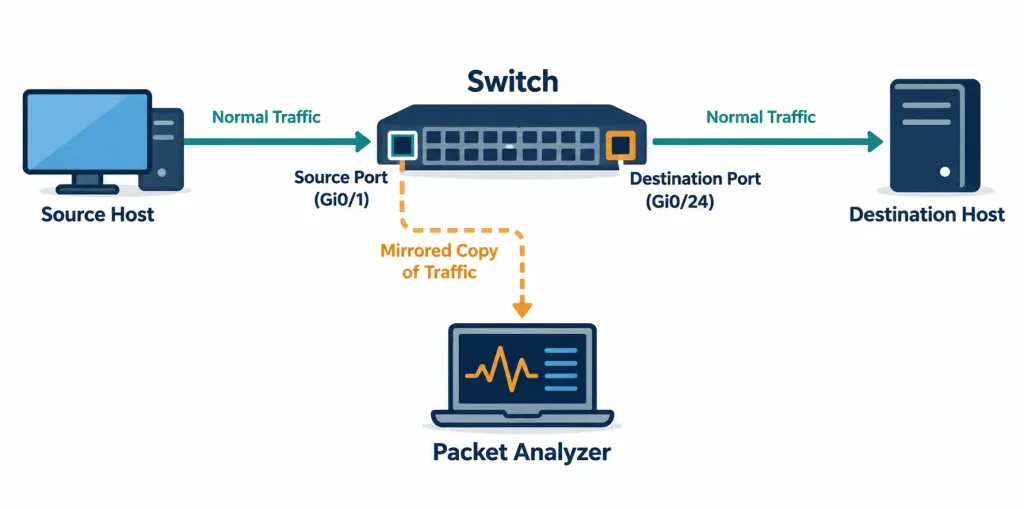
The key property of SPAN is that it’s passive and non-disruptive: the original traffic keeps flowing normally through its intended path, while an identical copy is sent to the monitoring port. This is what makes it possible to run deep packet-level analysis on live production traffic without inserting a device inline that could itself become a point of failure or introduce latency into the actual traffic path.
Network Discovery
Network discovery automates the process of identifying what’s actually connected to a network — scanning subnets, querying devices, and building (or verifying) an inventory of what exists and how it’s configured. This connects directly back to the asset inventory concept from earlier in this module: a manually maintained inventory tends to drift out of date as devices are added, removed, or replaced, while automated network discovery can periodically re-scan and flag discrepancies — an unexpected new device showing up, or a documented device that’s no longer responding.API Integration
Modern monitoring platforms increasingly rely on API integration rather than depending solely on SNMP or syslog. An API lets a monitoring tool pull structured data directly from a device, a cloud platform, or another management system — and often lets it push configuration changes back the other direction too. This matters especially in environments spanning both on-premises and cloud infrastructure, where cloud resources typically don’t expose SNMP at all and instead offer their own vendor-specific APIs as the primary way to retrieve monitoring data or automate changes.
Choosing the Right Monitoring Approach
Each of these tools fits a different need, and real network operations typically use several together rather than relying on just one:
| Tool | Best For | Overhead |
|---|---|---|
| Flow data (NetFlow/sFlow) | Ongoing traffic pattern visibility, top talkers, capacity planning | Low |
| Packet capture | Deep protocol troubleshooting of a specific, known issue | High |
| SPAN/port mirroring | Delivering live traffic to a capture tool without disruption | Low (mechanism itself) |
| Network discovery | Verifying and maintaining an accurate device inventory | Low, periodic |
| API integration | Pulling data from or automating cloud and modern platforms | Varies |
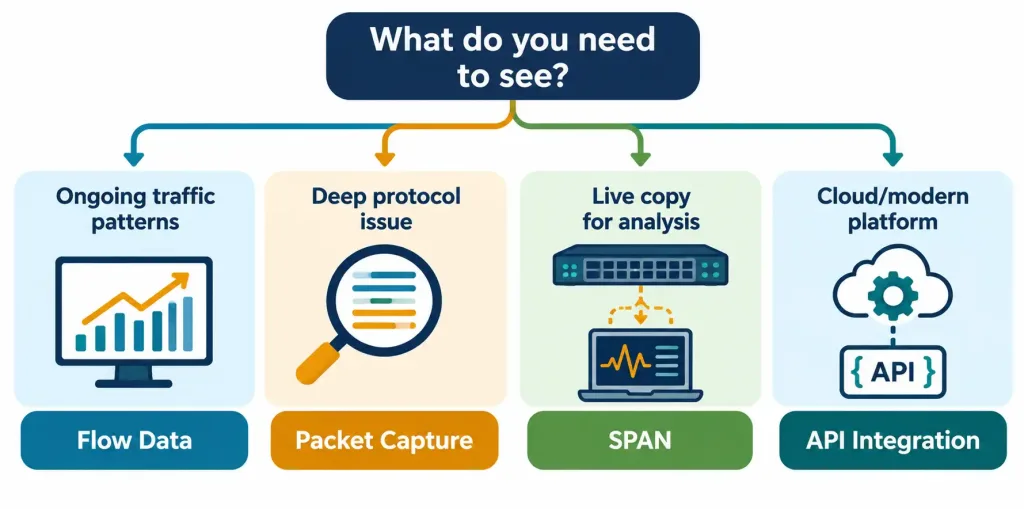
Reaching for full packet capture on every link all the time would be wasteful and often impractical; relying only on flow data would leave genuine protocol-level problems invisible. The skill is picking the right level of visibility for the actual question being asked.
Recognition-Level Verification Concepts
A few patterns are worth recognizing on sight:
- Traffic data showing source/destination and byte counts, but no actual payload content, is flow data, not packet capture.
- A switch configuration copying traffic from one port to another monitoring port, without affecting the original path, is SPAN/port mirroring.
- An automated scan producing a new or updated device inventory list is network discovery.
- A monitoring tool pulling metrics from a cloud service with no SNMP involved at all is almost certainly using API integration.
Common Exam Traps
- Flow data and packet capture are not the same level of detail. Flow data is summarized metadata; packet capture is the actual packet contents — don’t assume flow data can answer a question that requires inspecting payload content.
- SPAN is passive and doesn’t affect the original traffic path. It’s a copy mechanism, not an inline device that traffic must pass through to reach its destination.
- Packet capture’s overhead makes it a targeted, temporary tool in most real deployments, not something run continuously and everywhere the way flow data monitoring often is.
- Network discovery complements, but doesn’t replace, a maintained asset inventory. It’s a verification and update mechanism, catching drift between documentation and reality.
- API integration isn’t just “a newer version of SNMP.” It’s often the only practical option for cloud and modern platform monitoring, where SNMP typically isn’t available at all.
Lesson 3.2.2 Practice Quiz — Advanced Monitoring Techniques
17 questions covering flow data, packet capture, SPAN/port mirroring, network discovery, and API integration.
N10-009 · Domain 3.2Summary
Flow data (NetFlow/sFlow) summarizes traffic metadata — source, destination, port, protocol, and volume — without recording actual packet content, making it efficient for ongoing traffic visibility.
Packet capture records full packet contents for deep protocol troubleshooting, at the cost of significantly higher storage and processing overhead.
SPAN/port mirroring copies traffic from source ports to a destination port passively, letting a capture tool analyze live traffic without disrupting the original path.
Network discovery automates scanning to verify and update device inventory, catching drift between documentation and what's actually connected.
API integration lets monitoring tools pull data from and push changes to modern and cloud platforms that typically don't support SNMP at all.
Real network operations combine these tools based on the specific question being asked, rather than relying on any single one for everything.